...
This document is mainly suitable for users who build and compile robox container Android emulation.
Deployment Architecture

Figure1: Deployment Figure1 Deployment Main Framework

Figure2:Figure2 Robox Robox Framework
Pre-Installation Requirements
...
item | comments | method |
os | ubuntu 18.04.3/6(key) |
|
robox | robox is an Android container. | git clone https://github.com/kunpengcompute/robox.git -b release-phase2.3 |
robox Compile and run dependent packages | support for robox compilation and operation. | apt-get install build-essential cmake cmake-data debhelper dbus google-mock libboost-dev libboost-filesystem-dev libboost-log-dev libboost-iostreams-dev libboost-program-options-dev libboost-system-dev libboost-test-dev libboost-thread-dev libcap-dev libdbus-1-dev libdbus-cpp-dev libegl1-mesa-dev libgles2-mesa-dev libglib2.0-dev libglm-dev libgtest-dev liblxc1 libproperties-cpp-dev libprotobuf-dev libsdl2-dev libsdl2-image-dev lxc-dev pkg-config protobuf-compiler |
docker | needed by K8S/Robox | apt-get install docker.io |
...
ls out/target/product/arm64/
android-info.txt obj previous_build_config.mk mk recovery symbols system.img build_fingerprint.txt cache.img data gen module-info.json ramdisk.img root system userdata.img
...
container name format: instance + id
docker exec -it instance1 sh
...
Robox can be much more effectively deployed, run, monitored, and analyzed for multiple host nodes. Here is k8s cluster setup and container orchestration.
1 Basic Architecture
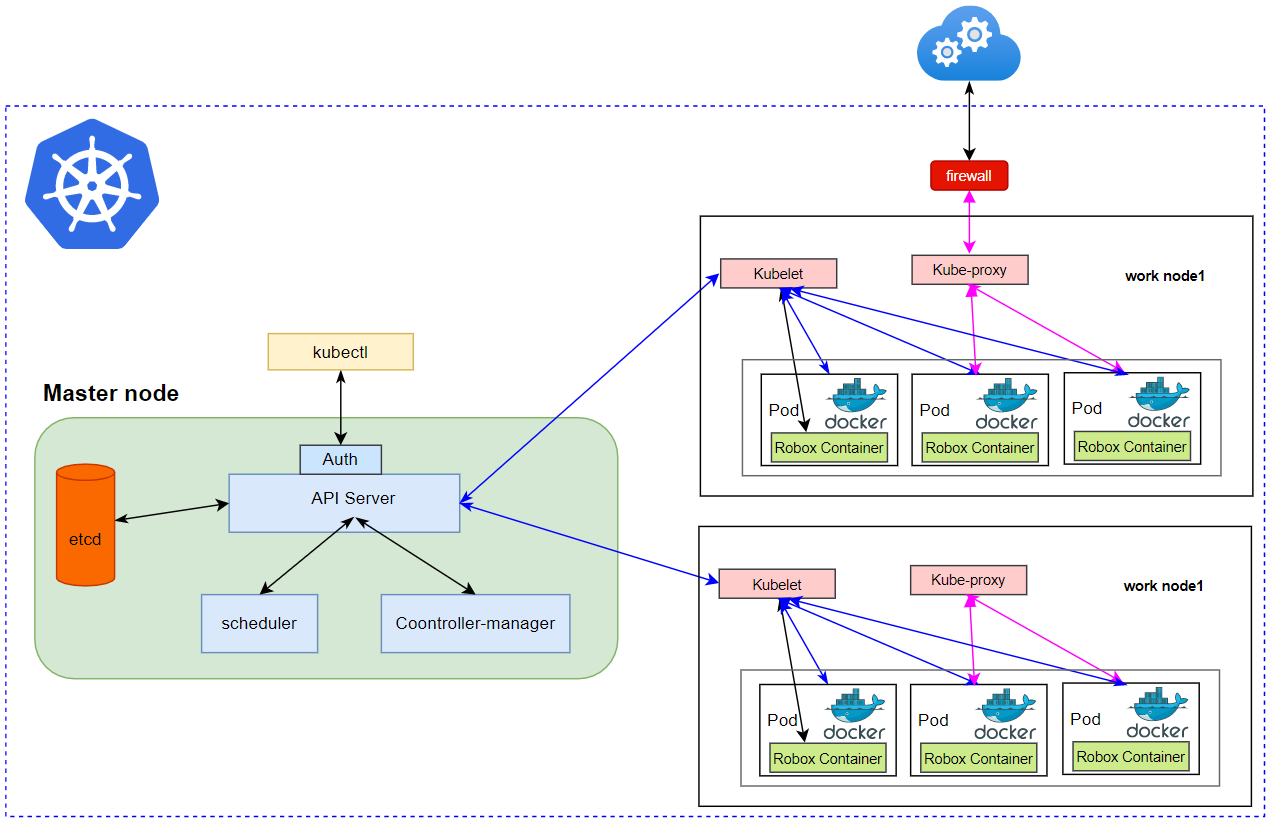
Figure3 Figure3: View Of Robox In Cluster
2 K8s Cluster construction
...
url:master-ip-address:30080
user:admin
password:Kuboard123
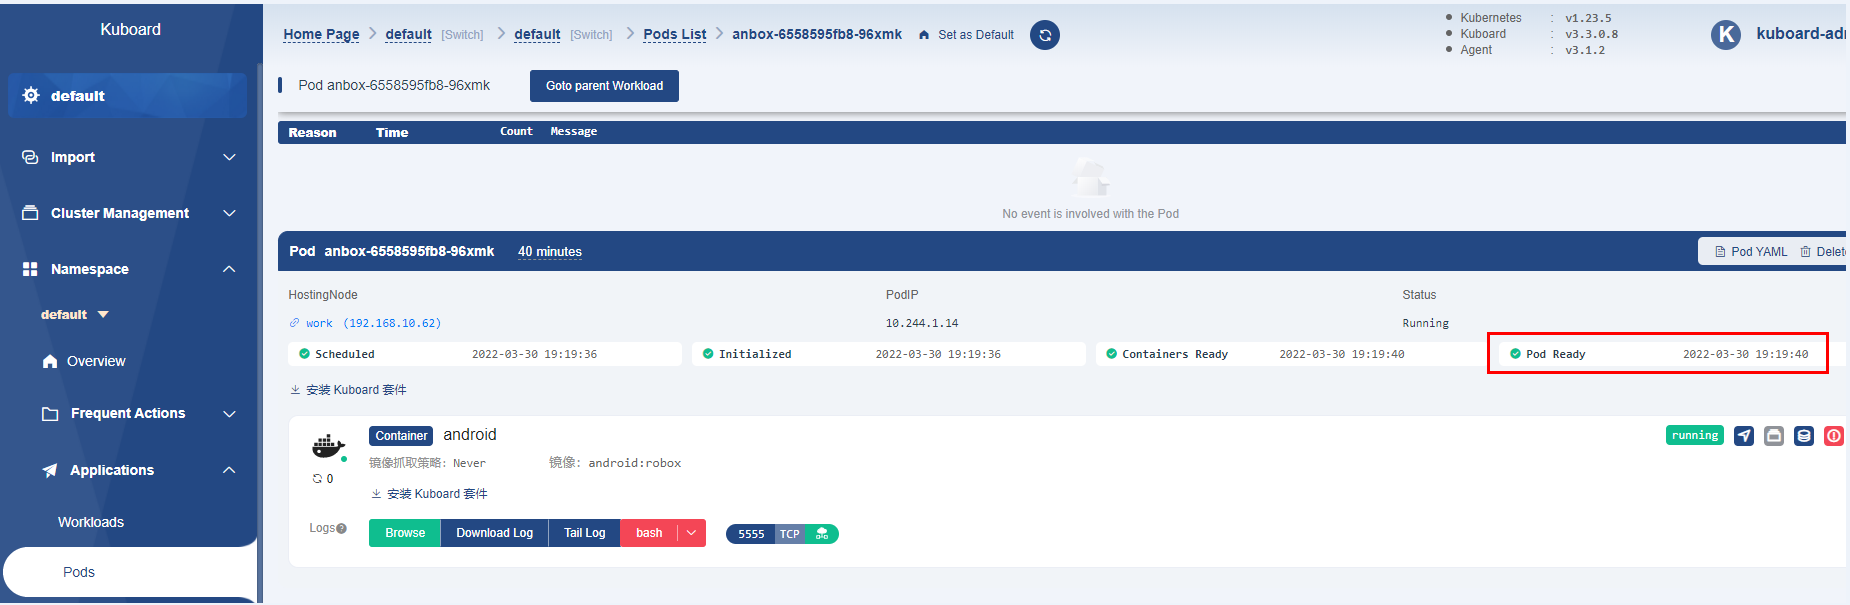
Figure4 Figure4: View of Robox On Kuboard
Cloud platform monitoring & Analyze
1 Basic Architecture
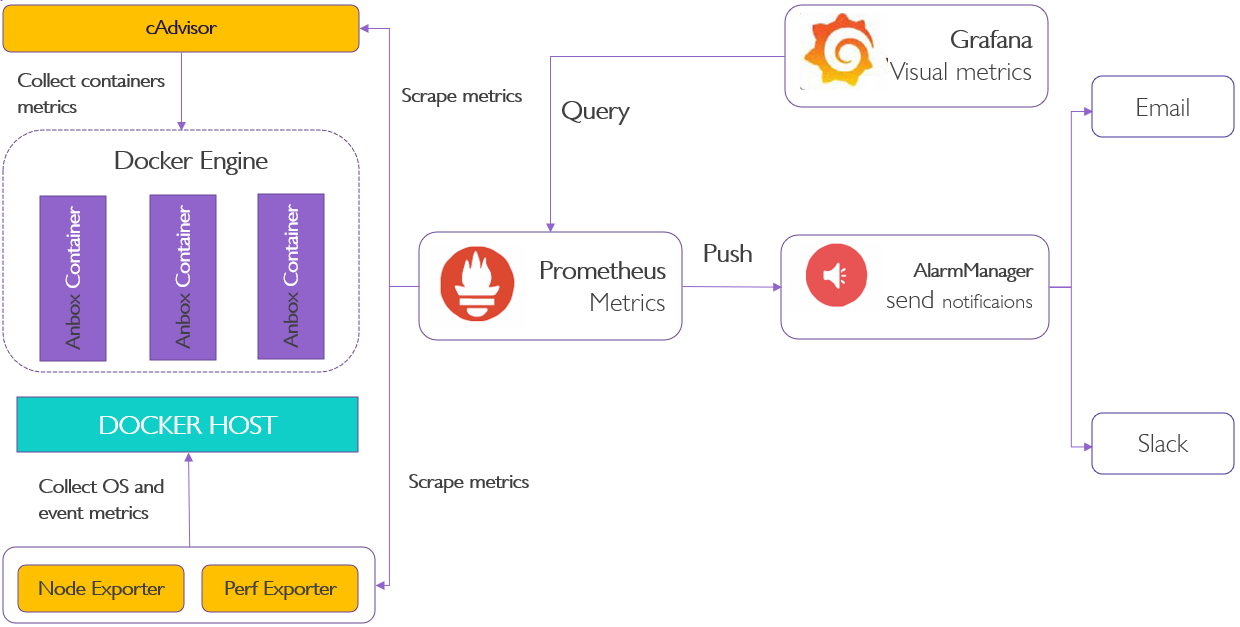
Figure5: Prometheus Figure5 Prometheus and Grafana Mix
2 Bootup basic components
...
Let us explore data that Prometheus has collected about itself. To use Prometheus's built-in expression browser, navigate to http://localhost:9090/graph and choose the "Table" view
...
prometheus_target_interval_length_seconds
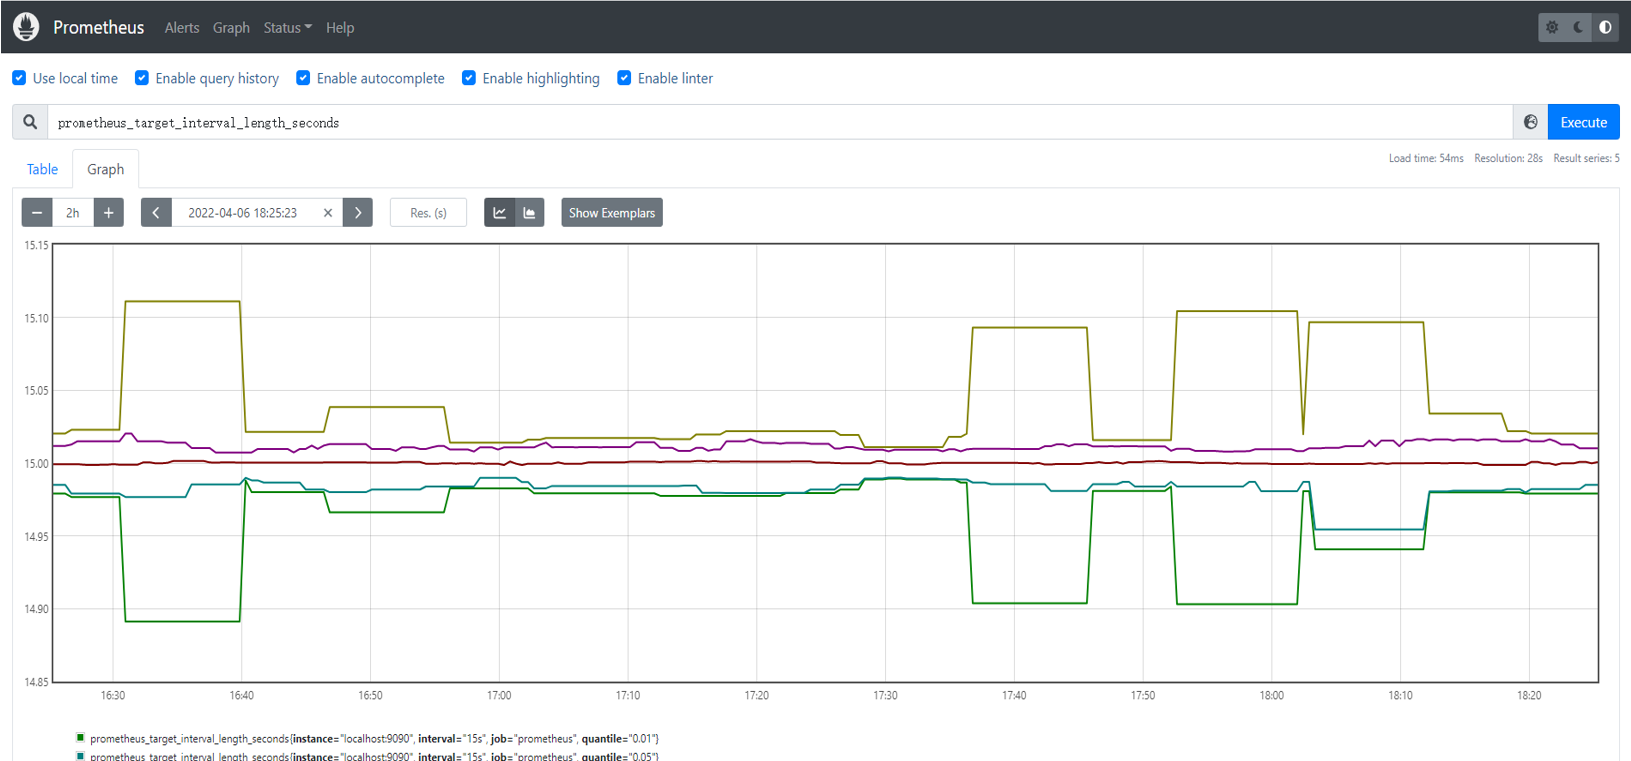
Figure6 Figure6: First Startup View Of PromethusPrometheus
In addition, we can log in to grafana through a web browser and see the effect as shown below
url: http://localhost:3000
user: admin
password: admin
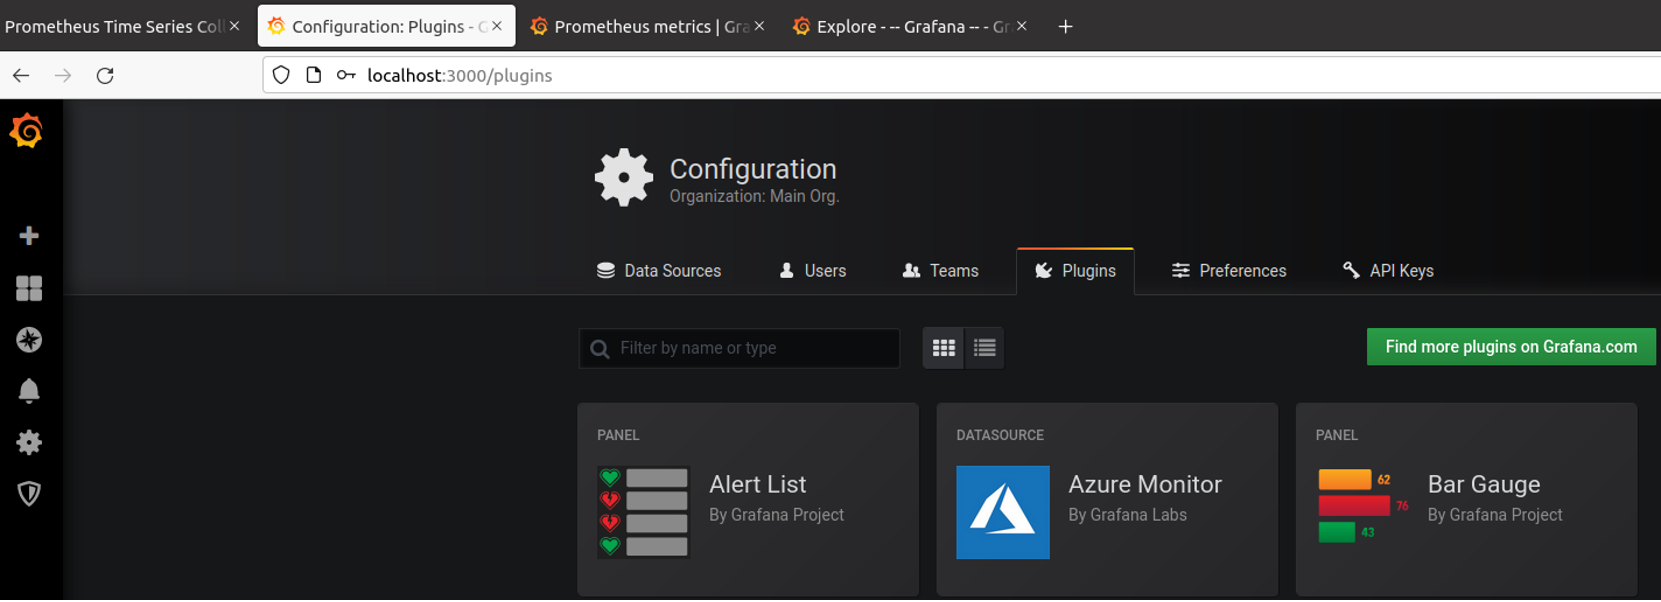
Figure7 Figure7: First First Startup View Of Grafana
Developer Guide and Troubleshooting
...