| Table of Contents |
|---|
Introduction
IEC Type3 mainly focus on Android Application running on edge ARM Cloud architecture with GPU/ vGPU Management. Also, ARM cloud games need to have the basic features of "cloud”, such as flexibility ,
availability everywhere. Based on cloud infrastructure optimized for android application, providing ARM application services.
How to use this document
This document describes the construction, compilation and use of robox Android container environment. Introduce environment configuration, code download, build and compile, and how to use it.
This document is mainly suitable for users who build and compile robox container Android emulation.
Deployment Architecture

Core Figure1 Deployment Main Framework

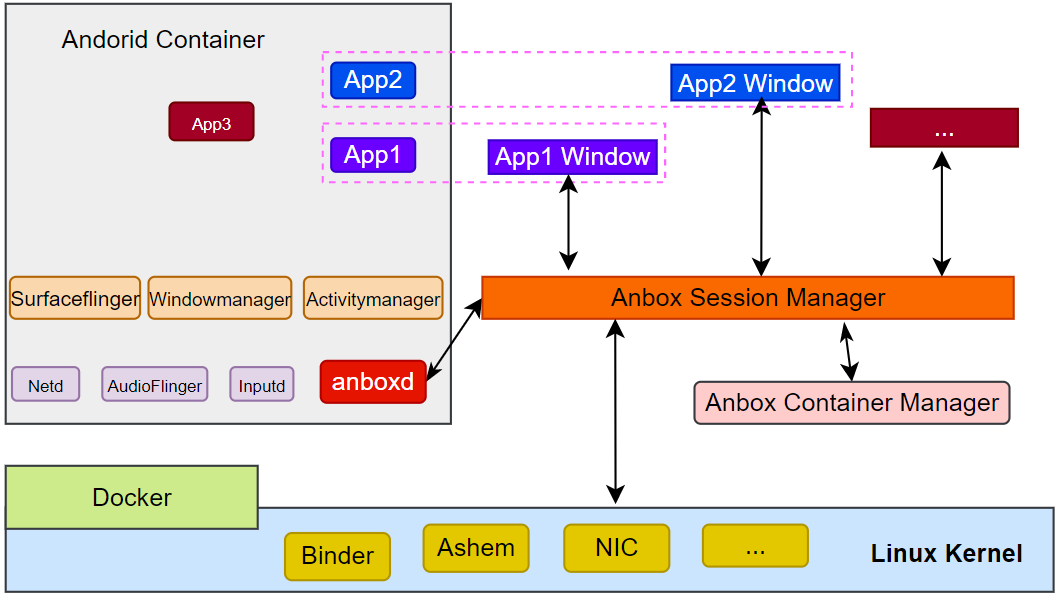
Robox Figure2 Robox Framework
Pre-Installation Requirements
...
ARM Server satisfies the Arm Server Ready certified.
Software Perequisites
item | comments | method |
os | ubuntu 18.04.3/6(key) |
|
robox | robox is an Android container. | git clone https://github.com/kunpengcompute/robox.git -b release-phase2.3 |
robox Compile and run dependent packages | support for robox compilation and operation. | apt-get install build-essential cmake cmake-data debhelper dbus google-mock libboost-dev libboost-filesystem-dev libboost-log-dev libboost-iostreams-dev libboost-program-options-dev libboost-system-dev libboost-test-dev libboost-thread-dev libcap-dev libdbus-1-dev libdbus-cpp-dev libegl1-mesa-dev libgles2-mesa-dev libglib2.0-dev libglm-dev libgtest-dev liblxc1 libproperties-cpp-dev libprotobuf-dev libsdl2-dev libsdl2-image-dev lxc-dev pkg-config protobuf-compiler |
docker | needed by K8S/Robox | apt-get install docker.io |
Components Version
Anbox | Run Android applications on any GNU/Linux operating system. | |
Grafana | Compose and scale observability with one or all pieces of the stack | 8.4.3 |
Prometheus | Cloud native system performance monitoring | 2.34.0 |
K8s | container orchestration engine for automating deployment, scaling, and management of containerized applications | k8s: v1.23.5; kube-apiserver:v1.21.11 kube-scheduler:v1.21.11 kube-proxy:v1.21.11 etcd:3.4.13-0 coredns:v1.8.0 |
...
Verifying the Setup as defined the Akraino validation feature project plus any additional testing specific to the blue print
Install Main Components
Since Since the components and images required by the project are relatively large, and the process of compilation takes time, we store the compiled images on the github repository.
The link is: https://github.com/ysemi-computing/RoboxWidget.git
git clone https://github.com/ysemi-computing/RoboxWidget.git
After this step, The code structure after downloading is as follows:
RoboxWidget/
├── android.img
├── components│ components
├── grafana-server│ server
├── node_exporter│ exporter
├── perf_exporter│ exporter
└── prometheus
└── README.md
...
ls out/target/product/arm64/
android-info.txt obj previous_build_config.mk mk recovery symbols system.img build_fingerprint.txt cache.img data gen module-info.json ramdisk.img root system userdata.img
...
container name format: instance + id
docker exec -it instance1 sh
...
Robox can be much more effectively deployed, run, monitored, and analyzed for multiple host nodes. Here is k8s cluster setup and container orchestration.
1 Basic Architecture
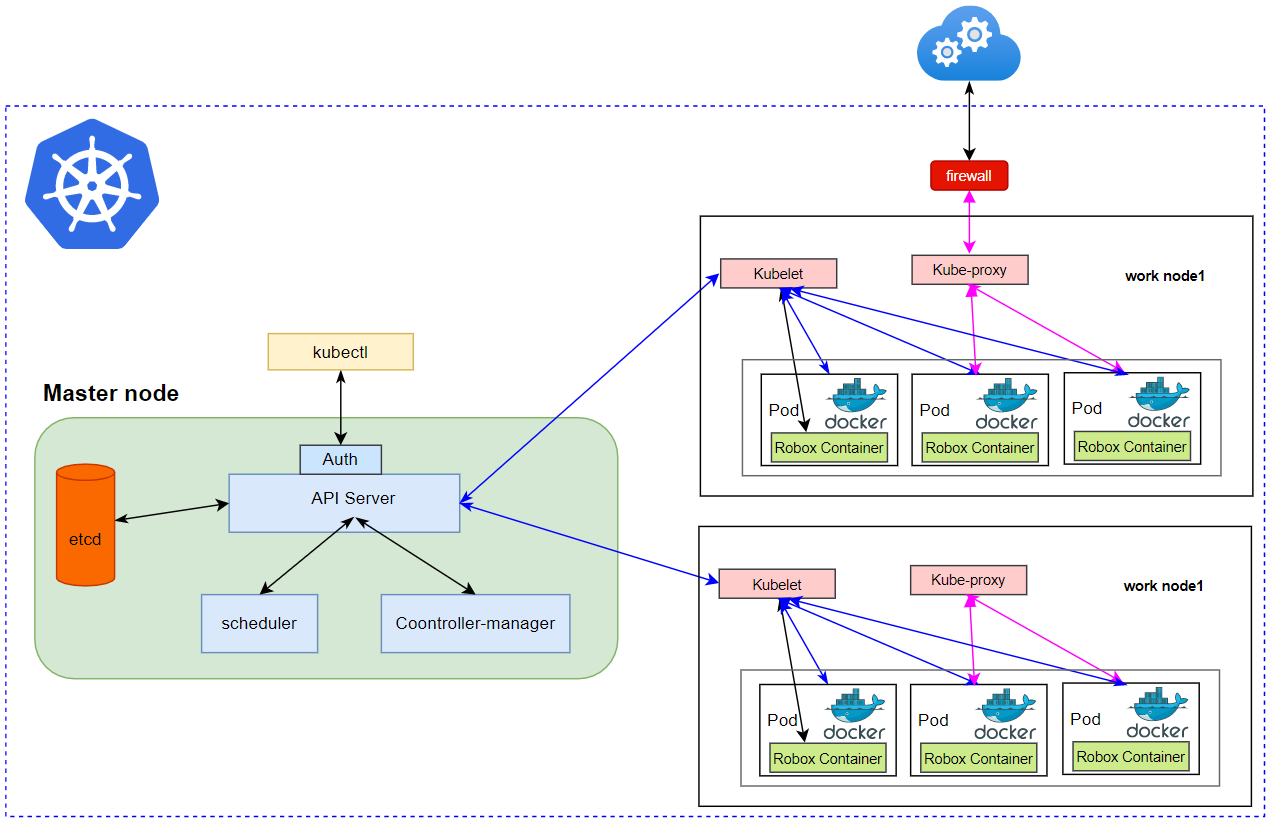

Figure3 View Of Robox In Cluster
2 K8s Cluster construction
...
git clone https://gerrit.akraino.org/r/iec.git
cd iec/deploy/compass && bash deployIEC.sh
Here is the current configuration:
- Ubuntu Version:18.04
- Docker: 20+
- k8s: 1.21.3
...
kubectl get cs
Warning: v1 ComponentStatus is deprecated in v1.19+
NAME STATUS MESSAGE ERROR
scheduler Healthy ok
controller-manager Healthy ok
etcd-0 Healthy {"health":"true"}
kubectl get node
NAME STATUS ROLES AGE VERSION
master Ready control-plane,master 22h v1.21.3
work Ready <none> 22h v1.21.5
At the same time, we can present the status of the cluster through the k8s visual component. We use kuboard, it is very convenient to install and use.
...
url:master-ip-address:30080
user:admin
password:Kuboard123
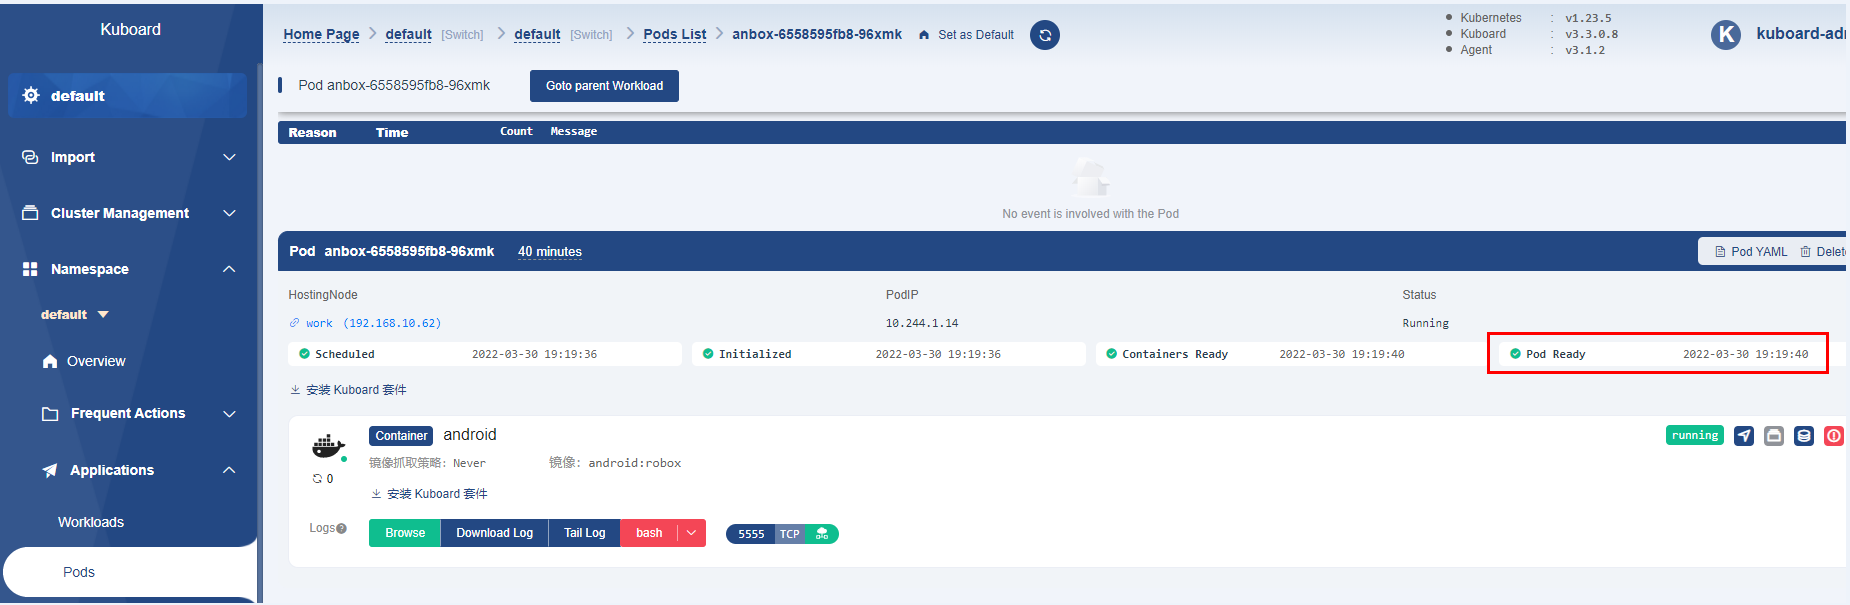
Figure4 View of Robox On Kuboard
Cloud platform monitoring & Analyze
1 Basic Architecture
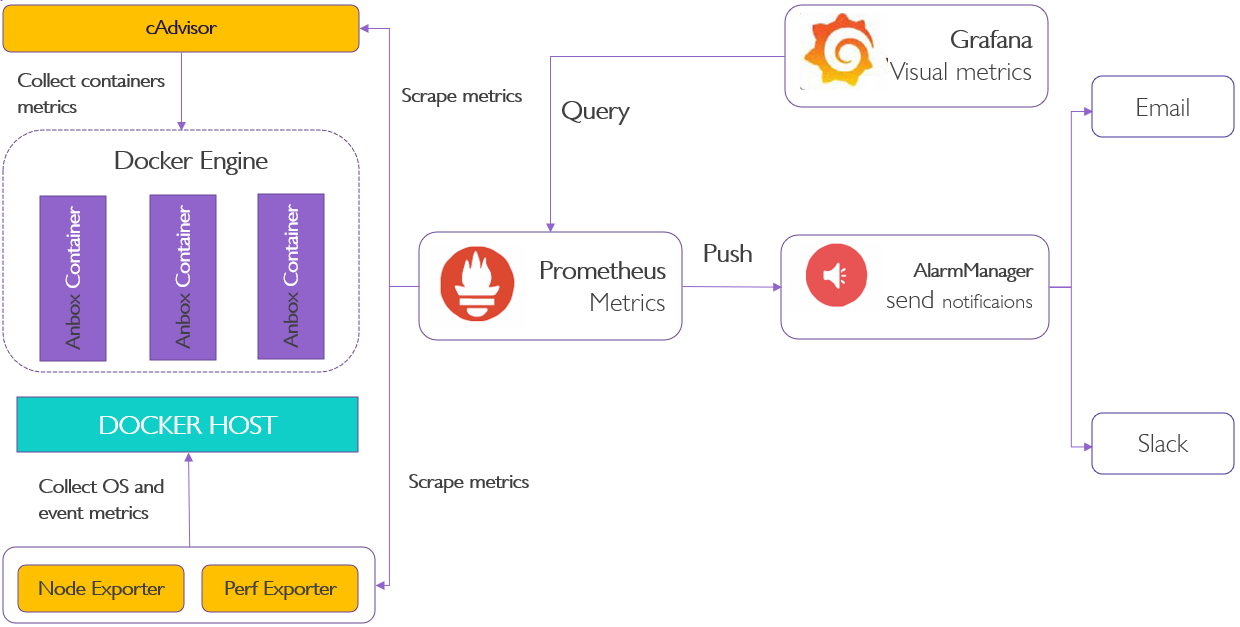
Figure5 Prometheus and Grafana Mix
2 Bootup basic components
...
Let us explore data that Prometheus has collected about itself. To use Prometheus's built-in expression browser, navigate to http://localhost:9090/graph and choose the "Table" view
...
prometheus_target_interval_length_seconds
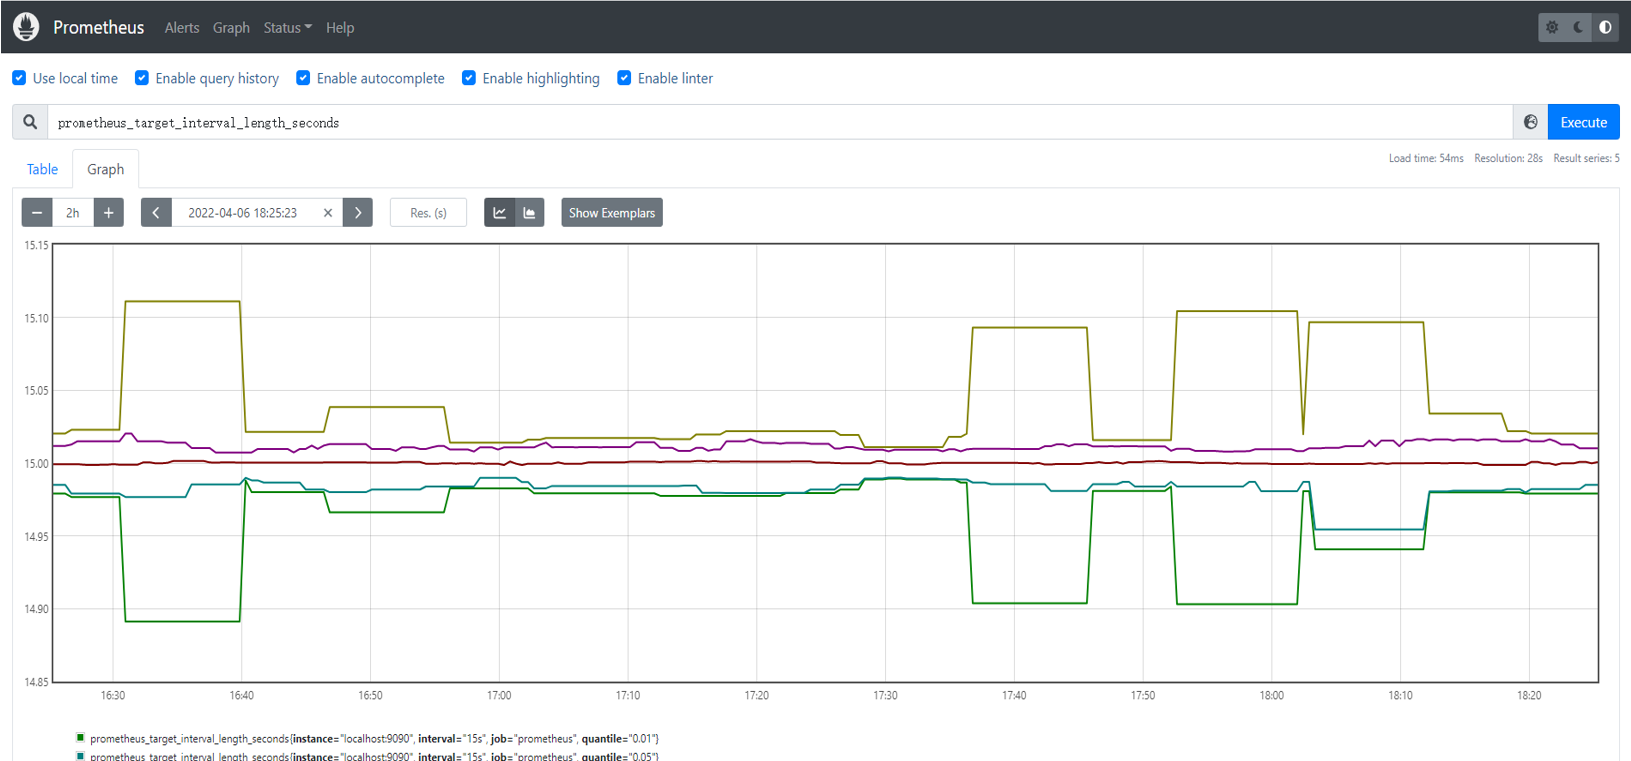
Figure6 First Startup View Of Prometheus
In addition, we can log in to grafana through a web browser and see the effect as shown below
url: http://localhost:3000
user: admin
password: admin
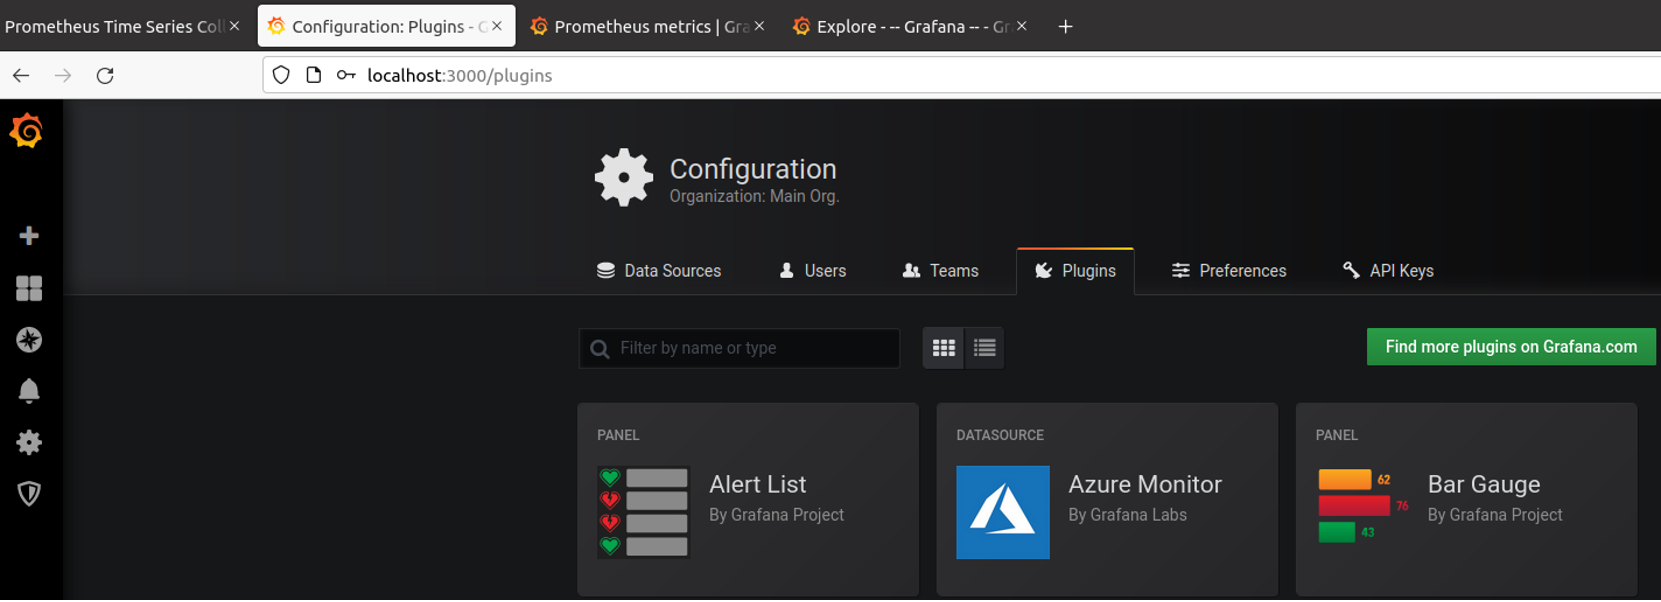
Figure7 First Startup View Of Grafana
Developer Guide and Troubleshooting
...