...
After this, the image of anbox has been completed, which can be viewed through docker related commands。Type the command below:
sudo docker images | grep robox
android robox e223a91c4b58 6 days ago 860MB
Run robox android system
After the above two scripts are executed, the robox operating environment is ready, and the entire directory structure of robox can be seen as follows
...
start the first continer instance
./robox -v start 1
./robox -v start 1
1 is the id, used by session manager and docker container
...
docker exec -it instance1 sh
step5step4: get android property sys.boot_completed
...
It is troublesome to start anbox robox through commands to deploy in a real environment. Here, the well-known K8S system is used to complete the deployment of anbox robox instances. On this basis, anbox
Robox can be much more effectively deployed, run, monitored, and analyzed for multiple host nodes. Here is k8s cluster setup and container orchestration.
...
The k8s cluster construction can be completed through the warehouse code, you can do as follows
git clone https://gerrit.akraino.org/r/iec.git
cd iec/deploy/compass && bash deployIEC.sh
Here Here is the current configuration:
...
kubectl apply -f https://addons.kuboard.cn/kuboard/kuboard-v3-swr.yaml
kubectl get cs
Warning: v1 ComponentStatus is deprecated in v1.19+
NAME STATUS MESSAGE ERROR
scheduler Healthy ok
controller-manager Healthy ok
etcd-0 Healthy {"health":"true"}
kubectl get node
NAME STATUS ROLES AGE VERSION
master Ready control-plane,master 22h v1.21.3
work Ready <none> 22h v1.21.5
...
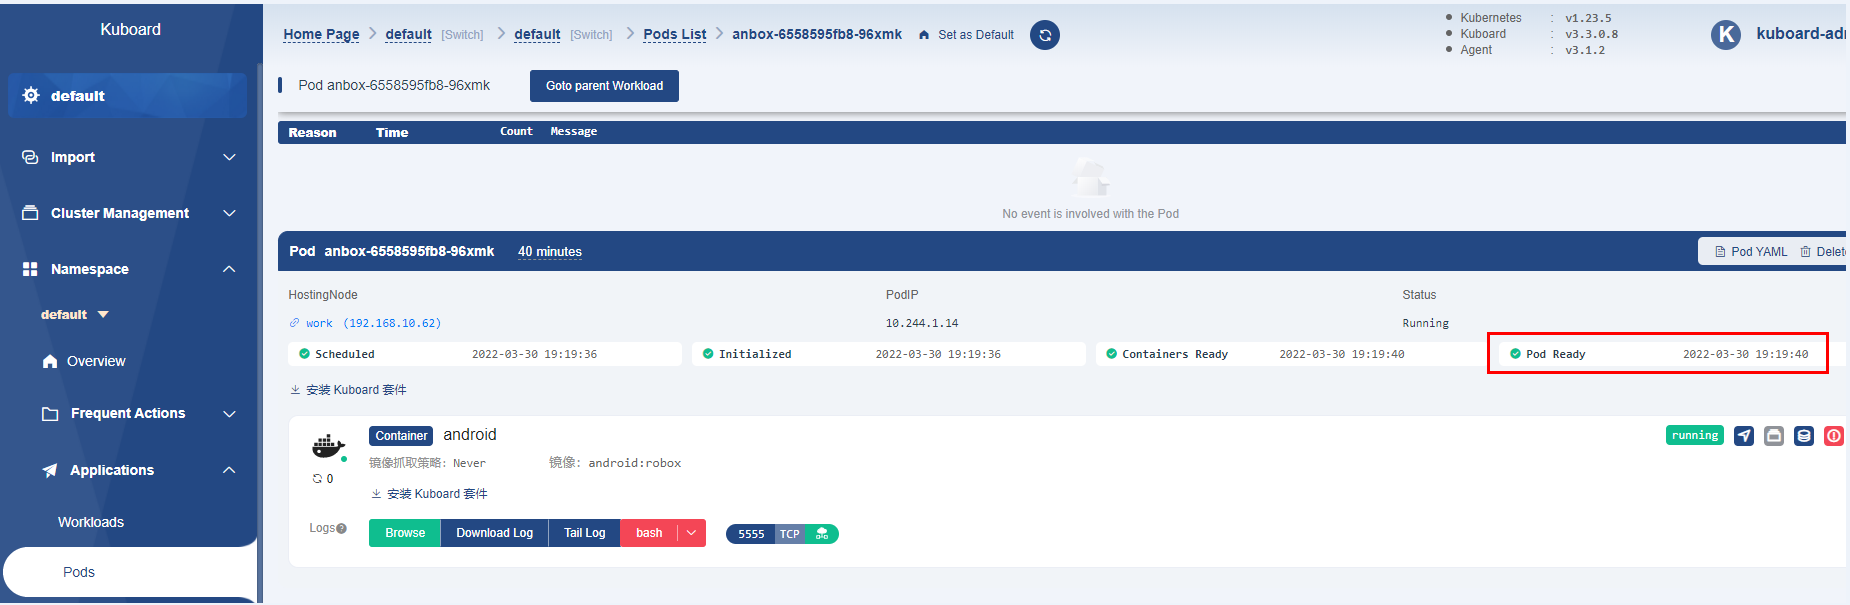
At the same time, we can present the status of the cluster through the k8s visual component. Here we We use kuboard, which it is very convenient to install and use.
then start kuboard with web browser
url:master-ip-address:30080
user:admin
password:Kuboard123
Cloud platform monitoring & Analyze
...
2 Bootup basic components
Prometheus Prometheus is only used for monitoring data. The real data needs an exporter. Different exporters export different data,These data are finally presented by prometheus.
Only node exporter and perf exporter are used in this project, these two can be directly downloaded and installed with binary files.
Prometheus is used for data monitoring,
and then a better visual interface is grafana, the data it needs can just be obtained through Prometheus.
This This project only needs to run the script below
https://github.com/ysemi-computing/RoboxWidget/blob/main/scripts/load_components.sh
.
After After the script is executed, the required Prometheus and grafana are downloaded and run in the background
...
3 Analyze data by web browser
Let us explore data that Prometheus has collected about itself. To use Prometheus's built-in expression browser, navigate to http://localhost:9090/graph and choose the "Table" view
within the "Graph" tab. Enter the below into the expression console and then click "Execute":
prometheus_target_interval_length_seconds
...
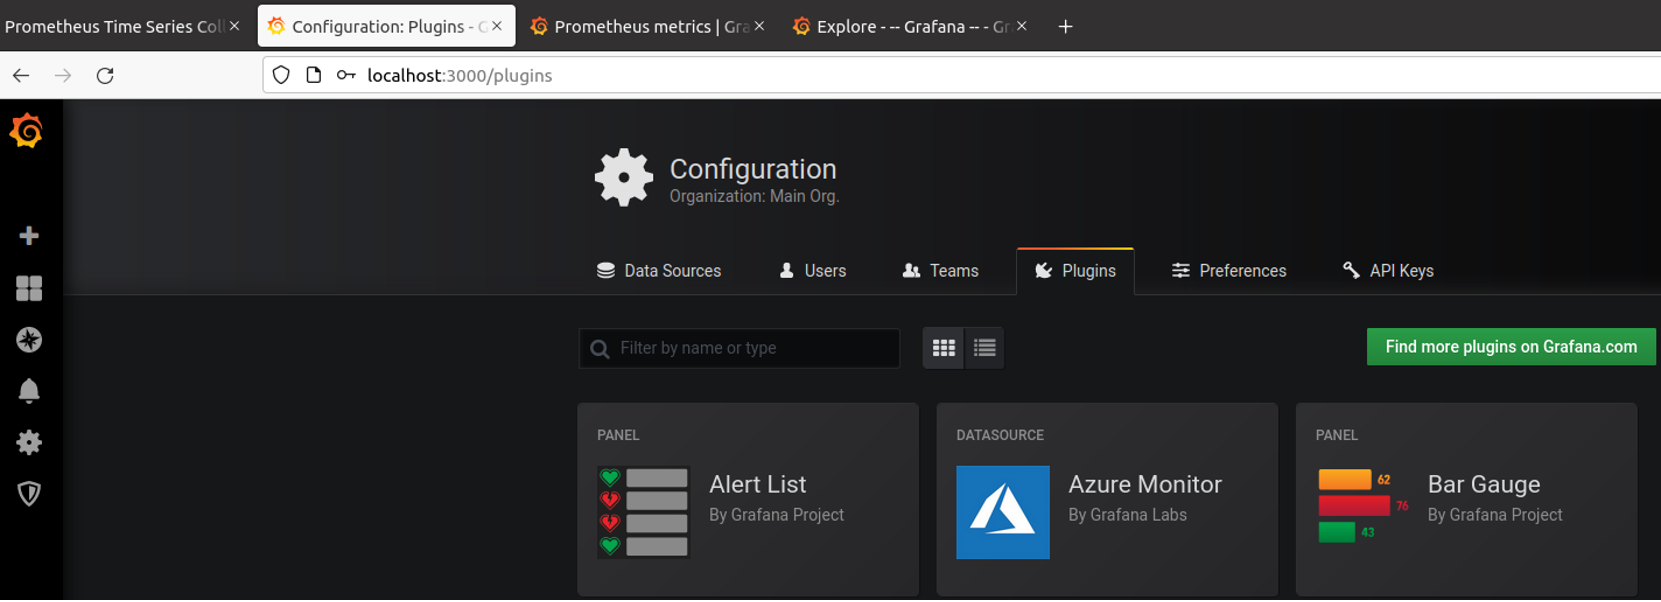
In addition, we can log in to grafana through a web browser and see the effect as shown below
user: admin
password: admin
Developer Guide and Troubleshooting
...