Introduction
Integrated Edge Cloud(IEC) is an Akraino approved blueprint family and part of Akraino Edge Stack, which intends to develop a fully integrated edge infrastructure solution, and the project is completely focused
towards Edge Computing. This open source software stack provides critical infrastructure to enable high performance, reduce latency, improve availability, lower operational overhead, provide scalability, address
security needs, and improve fault management.
The first step test mainly focus on the Android system running on edge ARM Cloud environment and make sure the Android system available.
Akraino Test Group Information
Testing Working Group Resources
Test Architecture
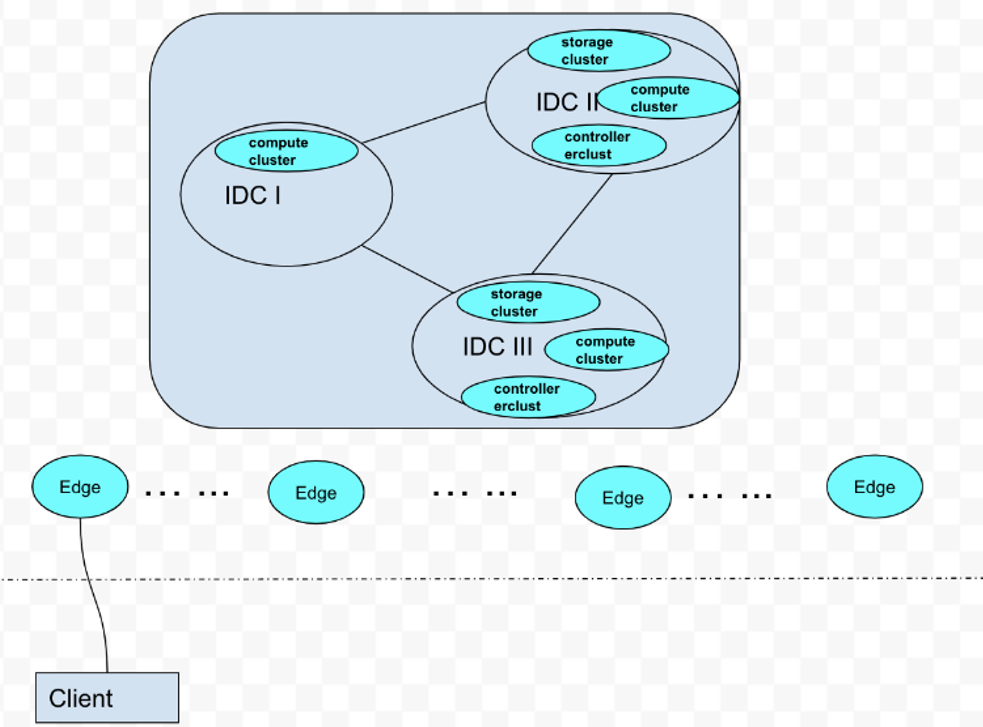
As picture aboved show, an android phone (Client) connect to our Edge Android Cloud. We plan to test the functional completeness and performance:
- application operation on the client side by adb
- deploy robox by k8s
- system performace monitor by prometheus
Test Bed
The testbed setup is shown in the below diagram.
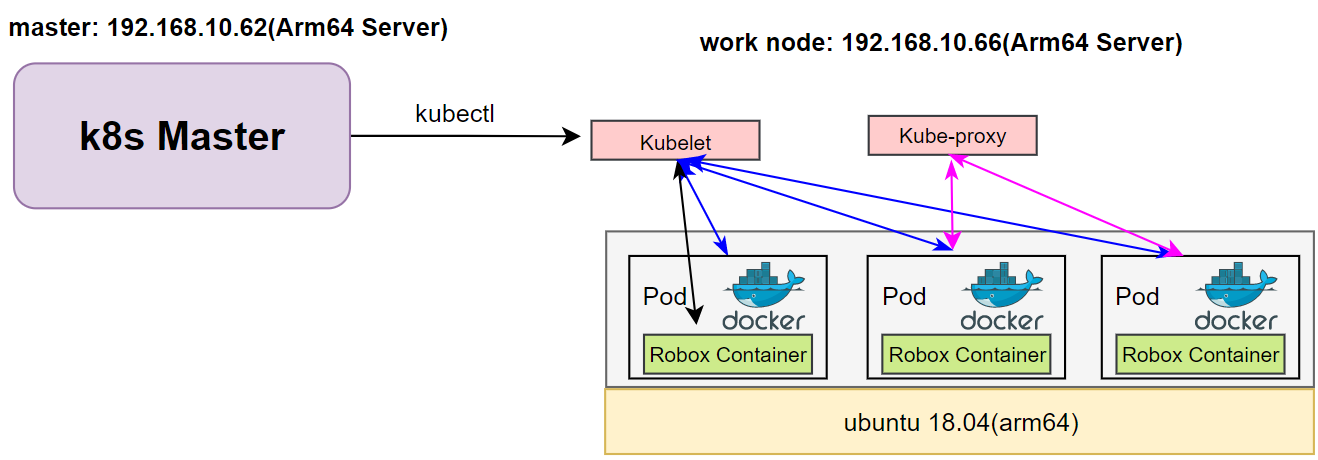
Figure1 Run Robox Through K8s
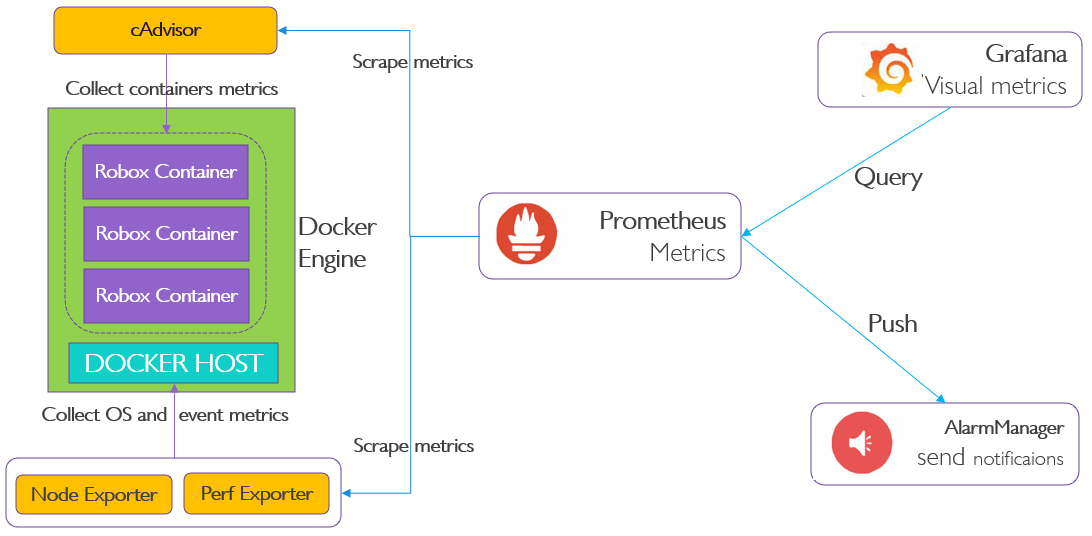
Figure2 Collect Data From Node
Test Environment
Hardware Requirements
2*arm64 server:
Arch | Aarch64 |
Processor model | 1*Aarch64 processor, 1* Aarch64 processor, |
RAM | 16*DDR4-2933 |
Storage | 10*2.5 inch SAS/SATA/SSD or 8*2.5 inch NVMe SSD |
Network | 1 onboard network card, each card supports 4*GE port or 4*10GE port or 4*25GE port |
Power Supply | Power 100~240V AC,240V DC |
ARM Server satisfies the Arm Server Ready certified.
Software Perequisites
item | description | addition |
os | ubuntu 18.04.3(key) | |
robox | Android container | |
docker | container for android image | apt-get install docker.io |
Components Version
Anbox | Run Android applications on any GNU/Linux operating system. | |
Grafana | Compose and scale observability with one or all pieces of the stack | 8.4.3 |
Prometheus | Cloud native system performance monitoring | 2.34.0 |
K8s | container orchestration engine for automating deployment, scaling, and management of containerized applications | k8s: v1.23.5; kube-apiserver:v1.21.11 kube-scheduler:v1.21.11 kube-proxy:v1.21.11 etcd:3.4.13-0 coredns:v1.8.0 |
Bootup Basic components
We have cloned the iec repository code to github, the link is:
https://github.com/ysemi-computing/iec.git
then do as follow steps, all operations are on master node.
Step1: startup the k8s cluster by execute “deploy/compass/deployIEC.sh”
cd iec && bash deploy/compass/deployIEC.sh
Step2: mount the robox image and start the session_manager
ssh robox@192.168.10.66 bash iec/src/foundation/scripts/robox/loadimages.sh
ssh robox@192.168.10.66 bash iec/src/foundation/scripts/robox/sm_ctrl.sh
Step3: run some components for Cluster
ssh robox@192.168.10.66 bash iec/src/foundation/scripts/robox/ load_components.sh
Step4: run robox by K8S
bash iec/src/foundation/scripts/robox/test_robox.sh a
Display data through different components
1. By kubectl
kubectl get node,pods,svc -o wide -n kube-system -n default
NAME STATUS ROLESAGE VERSION INTERNAL-IP EXTERNAL-IP OS-IMAGE KERNEL-VERSION
node/master Ready control-plane,master 2d14h v1.21.5 192.168.10.66 <none> Ubuntu 18.04.6 LTS4.15.18 docker://20.10.14
node/work Ready <none> 2d14h v1.21.5 192.168.10.62 <none> Ubuntu 18.04.3 LTS 4.15.18 docker://20.10.14
NAME READY STATUS RESTARTS AGE IP NODE NOMINATED NODE READINESS GATES
pod/anbox-6c447fbd7-k8zl7 1/1 Running 0 76s 10.244.1.4 work <none> <none>
pod/nginx-c9zr9 1/1 Running 0 2d14h 10.244.1.3 work <none> <none>
NAME TYPE CLUSTER-IP EXTERNAL-IP PORT(S) AGE SELECTOR
service/anbox NodePort 172.16.1.74 <none> 8888:31000/TCP 76s app=android
service/kubernetes ClusterIP 172.16.1.1 <none> 443/TCP 2d14h <none>
service/nginx NodePort 172.16.1.138 <none> 80:31778/TCP 2d14h app=nginx
2. By Kuboard
Do as the install documentation, then deploy the kuboard
kubectl apply -f https://addons.kuboard.cn/kuboard/kuboard-v3-swr.yaml
login web browser, then switch to the Pods tab, it display as follow:
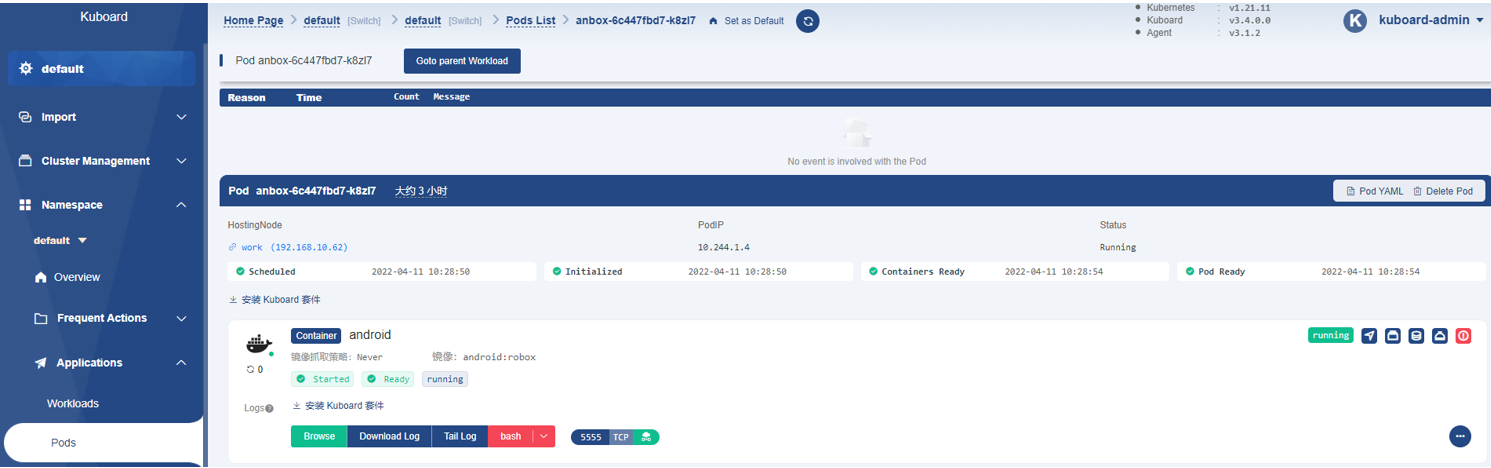
Figure3 Watch cluster pod status through kuboard
3. By Prometheus
login web browser, then switch to the Targets tab, it display as follow:
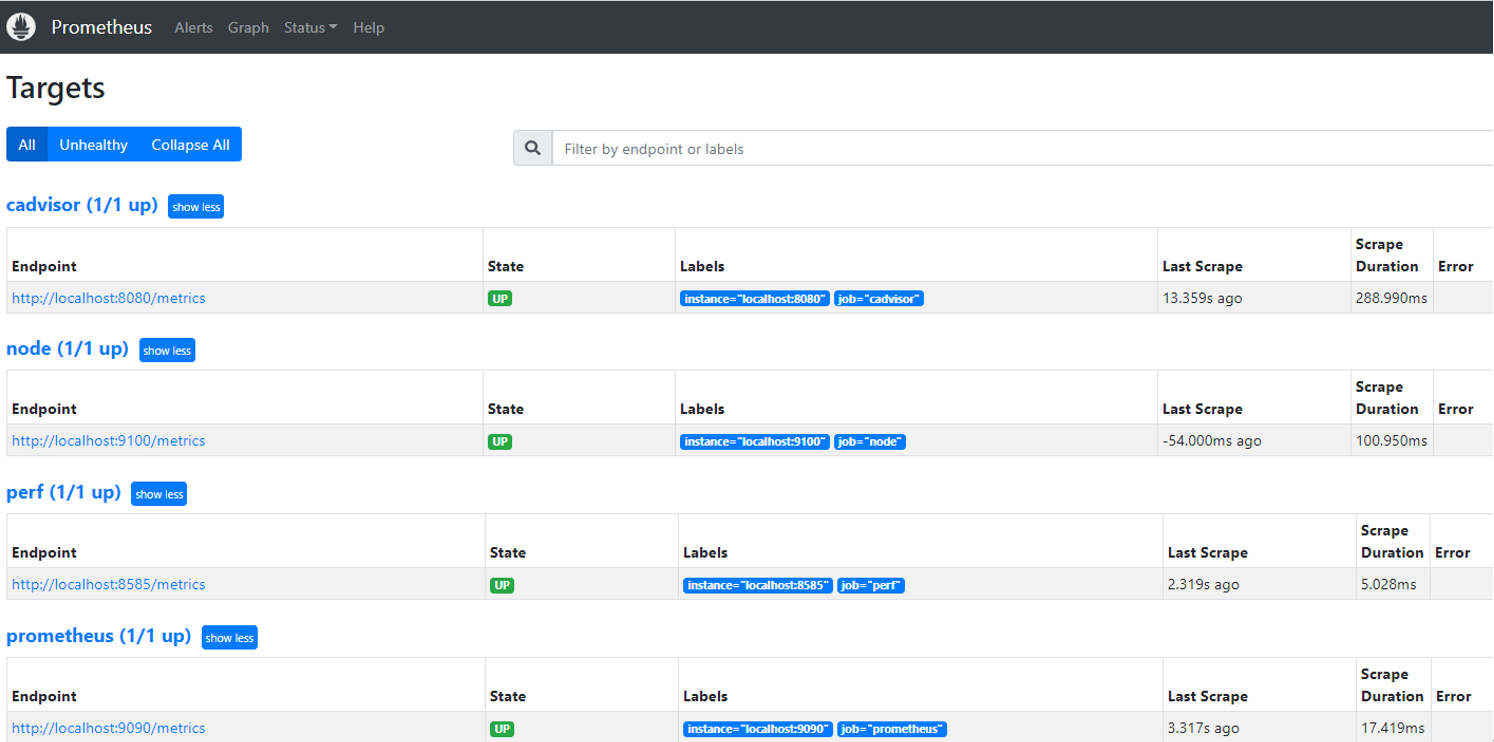
Figure4 Components on Prometheus
Then switch to the “Status” tab, the box is the event what we want to query, and type “perf_sched_sched_migrate_task”, After a few minutes, you can see
the monitoring curve as bellow:
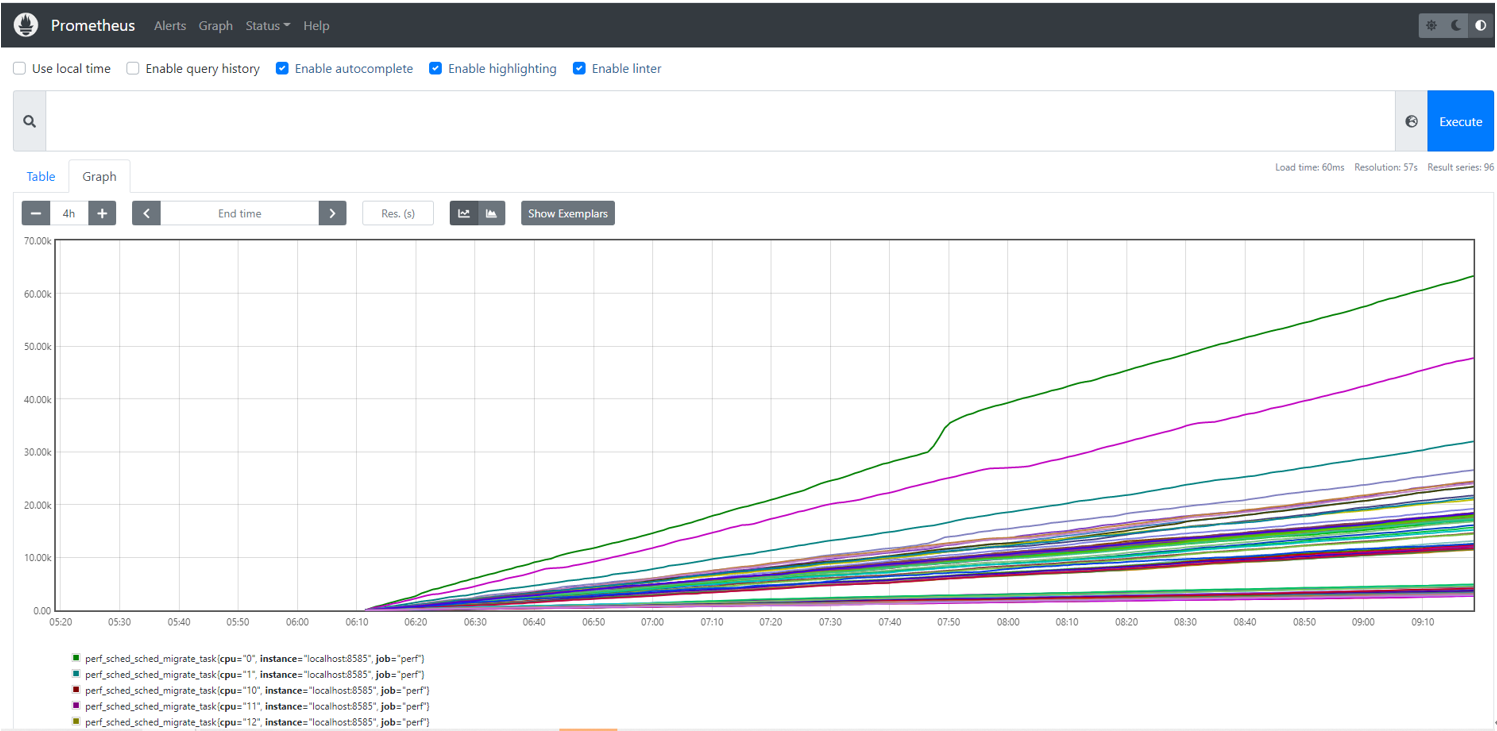
Figure5 Event Statistics On Prometheus
4. By grafana
step1: add data source
user: admin
password: admin
Click the below on dashboard:
Setting->Add Data Sources->Add data source
Select prometheus, where URL http://192.168.10.62:9090 or http://localhost:9090, Click save&test.
step2: import data source
Click the below on dashboard:
+ -> import -> enter dashboardid 1860(prometheus node is 1860)
Just click load.
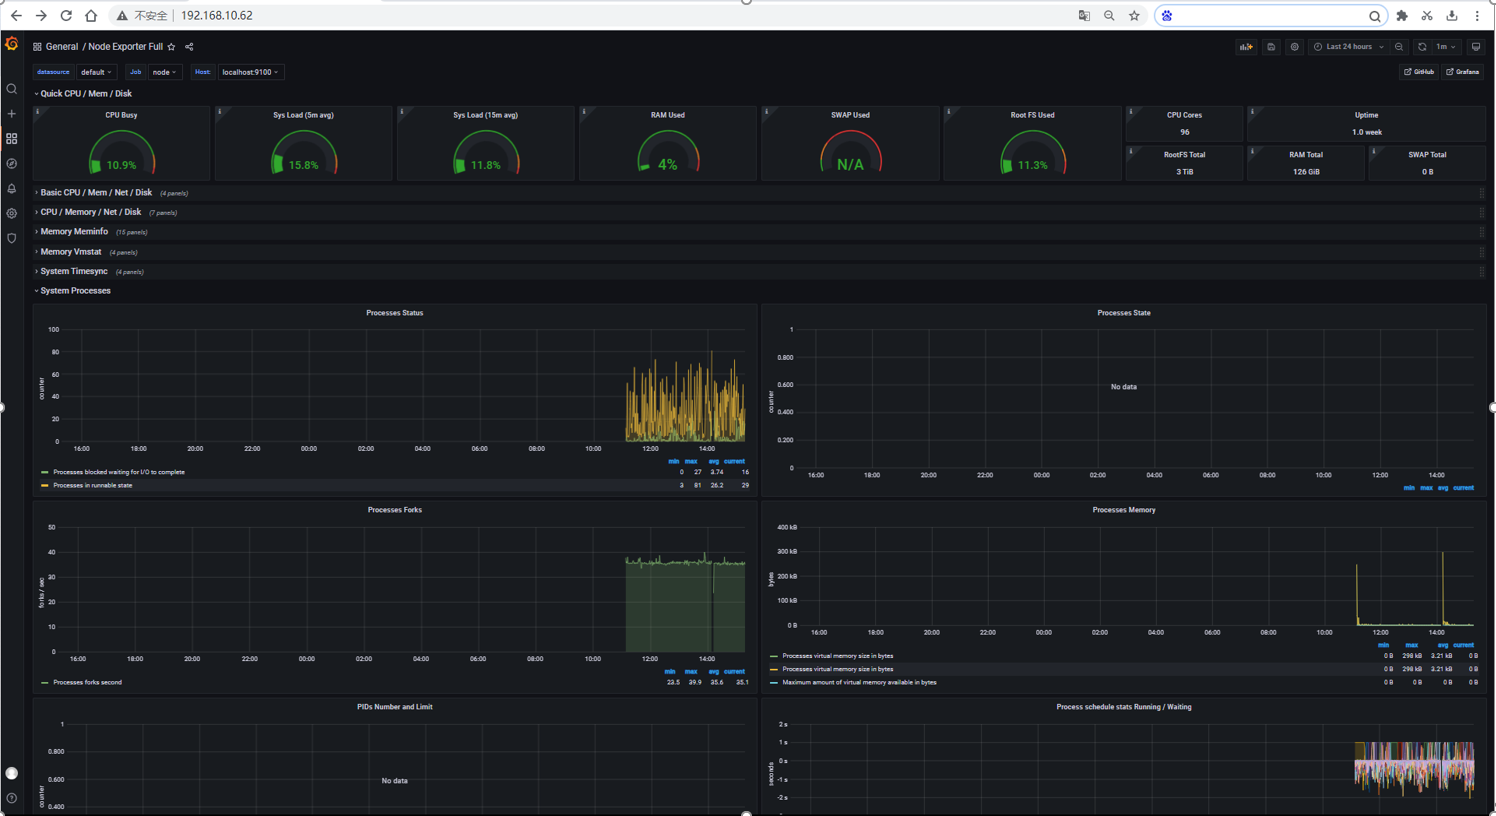
Figure6 Display Data Through Grafana
Test API description
The test is to evaluate the Android container available.
Thus we currently don't have any Test APIs provided.
Node Proformance Test
1. Install bomb squad on every Robox
Since the instance runs on the server, we need to use the remote tool vnc, so that we can interact through GUI.
To increase the workload, we need to start more robox instances.
Download bomb squad apk on googleplay and install via adb
adb connect nodeip:port
adb install zdxfd.apk
2. Start the bomb squad and do the settings
Click on the application icon, and then make the relevant settings, such as Auto test mode、Show FPS.
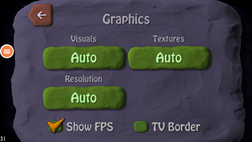

Figure7 Install Apk On Robox Container, Watched By VNC
We ran up to 20 instances on a single node, each instance ran an auto-tested bomb squad app, and we could watch the realtime fps.
3. Run perf in the background for event collection
When the node is running at full load, you can collect the corresponding system events through perf, and execute the following commands to collect different events.
sudo perf stat -e cycles,instructions,cache-references,cache-misses,bus-cycles -a sleep 10
sudo perf stat -e dTLB-load-misses,l1d_tlb_refill,iTLB-load-misses,l1i_tlb_refill sleep 10
sudo perf sched latency --sort runtime
sudo perf sched latency --sort switch
4. Generate flame graph
We save the events collected by perf locally, and then generate a flame graph, so that we can more intuitively see the system performance bottleneck.
sudo perf record -e cache-misses -ag -- sleep 10
sudo perf script -i perf.data |../FlameGraph/stackcollapse-perf.pl > out.perf-folded
cat out.perf-folded | ../FlameGraph/flamegraph.pl > perf_cache.svg
sudo perf record -e probe_libc:malloc -agR sleep 10
sudo perf script -i perf.data |../FlameGraph/stackcollapse-perf.pl > out.perf-folded
cat out.perf-folded | ../FlameGraph/flamegraph.pl > perf_malloc.svg
The flame graph display effect is as follows
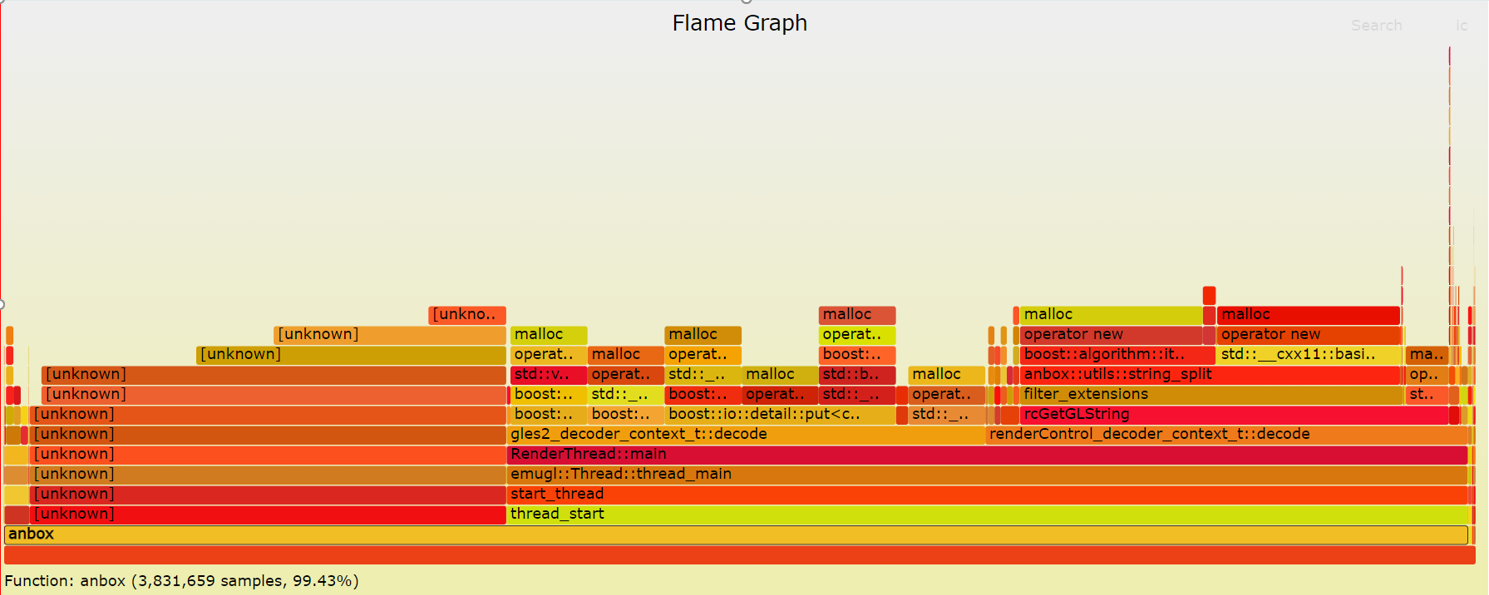
Figure8 Generate Flame Graph From Perf Events
Blueprint extension tests
The Test inputs
Test | Description | Result | Reference |
Robox Image | Robox Image Auto build | PASS | Installation Doc |
Robox Startup | Start Robox By Script | PASS | Installation Doc |
App Installation | Install and run app on a robox | PASS | Current Doc |
Edge Cluster Deployment | Deploy Edge K8S Clusters | Pass | Installation Doc |
Deploy Robox | Run Robox By K8s | PASS | Installation Doc |
Deploy Prometheus | Run Prometheus on Work node | PASS | Installation Doc |
Deploy Grafana | Run Grafana on Work node | PASS | Installation Doc |
Perf events | Run Perf Background to Fetch System Events | PASS | Current Doc |
Flame graph | Generate Flame Graph | PASS | Current Doc |
BluVal Tests
The Test inputs
BluVal Test Environment setup according to:
Test Procedure
- Clone BluVal Validation Framework into a arm64 Server:
- Copy .kube/config file and SSH key to the Test Machine
- Configure validation environment:
cat validation/bluval/bluval-robox.yaml
blueprint:
name: robox
layers:
- os
- docker
- k8s
# Any hardware some basic tests
os: &os_robox
-
name: ltp
what: ltp
optional: "True"
-
name: cyclictest
what: cyclictest
optional: "True"
-
name: lynis
what: lynis
optional: "False"
-
name: vuls
what: vuls
optional: "False"
docker: &docker_base
-
name: docker_bench
what: docker_bench
optional: "True"
k8s: &k8s
-
name: conformance
what: conformance
optional: "False"
-
name: etcd_ha
what: etcd_ha
optional: "True"
-
name: kube-hunter
what: kube-hunter
optional: "False"
cat validation/bluval/volumes.yaml
volumes:
ssh_key_dir:
local: '/root/.ssh'
target: '/root/.ssh'
kube_config_dir:
local: '/root/.kube/'
target: '/root/.kube/'
custom_variables_file:
local: '/opt/akraino/validation/tests/variables.yaml'
target: '/opt/akraino/validation/tests/variables.yaml'
blueprint_dir:
local: '/opt/akraino/validation/bluval'
target: '/opt/akraino/validation/bluval'
results_dir:
local: '/opt/akraino/results'
target: '/opt/akraino/results'
openrc:
local: ''
target: '/root/openrc'
layers:
common:
- custom_variables_file
- blueprint_dir
- results_dir
hardware:
- ssh_key_dir
os:
- ssh_key_dir
networking:
- ssh_key_dir
docker:
- ssh_key_dir
k8s:
- ssh_key_dir
- kube_config_dir
k8s_networking:
- ssh_key_dir
- kube_config_dir
openstack:
- openrc
sds:
sdn:
vim:
cat validation/tests/variables.yaml
### Input variables cluster's master host
host: 192.168.10.66 # cluster's master host address
username: root # login name to connect to cluster
password: 123456 # login password to connect to cluster
ssh_keyfile: /root/.ssh/id_rsa # Identity file for authentication
Since lynis execution requires root privileges, the username here needs to be specified as root
- Run BluVal Robot:
bash validation/bluval/blucon.sh robox
- Install LFTOOLS:
sudo apt install python3-pip
sudo python3 -m pip install -U pip
sudo python3 -m pip install -U setuptools
sudo -H pip3 install --ignore-installed PyYAML
pip3 install lftools
2. Push BluVal Results to Akraino Nexus
# Create .netrc file
vi ~/.netrc
machine nexus.akraino.org login ysemicn password xxx
# Archive log files
zip -r results.zip ./results
# Push logs to Nexus
lftools deploy nexus-zip https://nexus.akraino.org logs ysemi/job/v1 results.zip
Expected output:
Loading KWallet
Loading SecretService
Loading Windows
Loading chainer
Loading macOS
Zip file upload complete.
Test Results
https://nexus.akraino.org/content/sites/logs/ysemi/job/v1/ak_results/
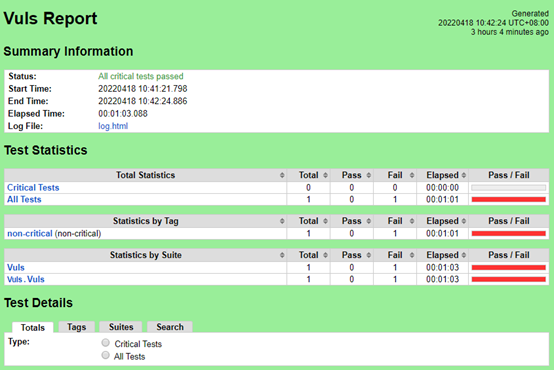
Vuls
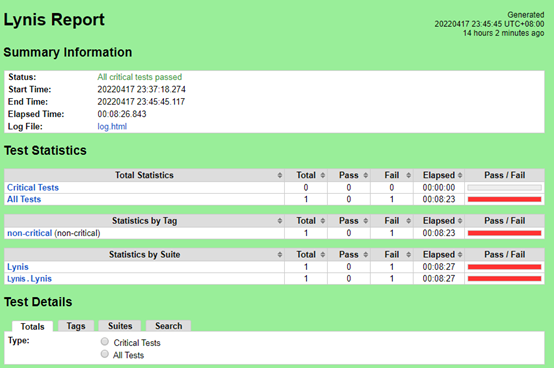
Lynis
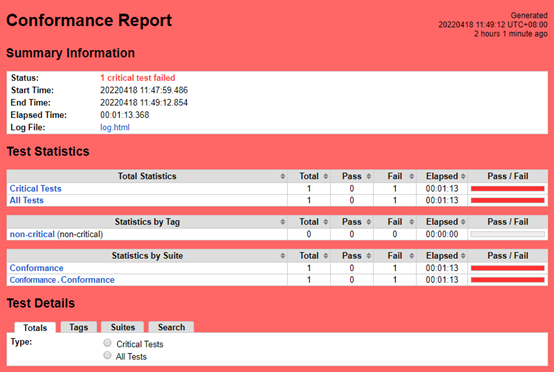
K8S Conformance
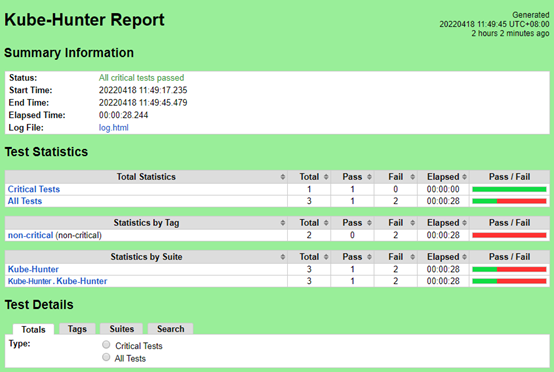
Kube-Hunter
Test Dashboards
Single pane view of how the test score looks like for the Blue print.
Test Group | Total Tests | Pass | Fail |
Blueprint Extension Tests | 10 | 10 | 0 |
Vuls | 1 | 1 | 0 |
Lynis | 1 | 1 | 0 |
K8S Conformance | 1 | 0 | 1 |
Kube-Hunter | 1 | 1 | 0 |
Additional Testing
N/A
Bottlenecks/Errata
N/A