You can just run the test from https://github.com/lf-edge/eden.git
The test is available through /tests/flir
https://github.com/lf-edge/eden/tree/master/tests/flir
The components
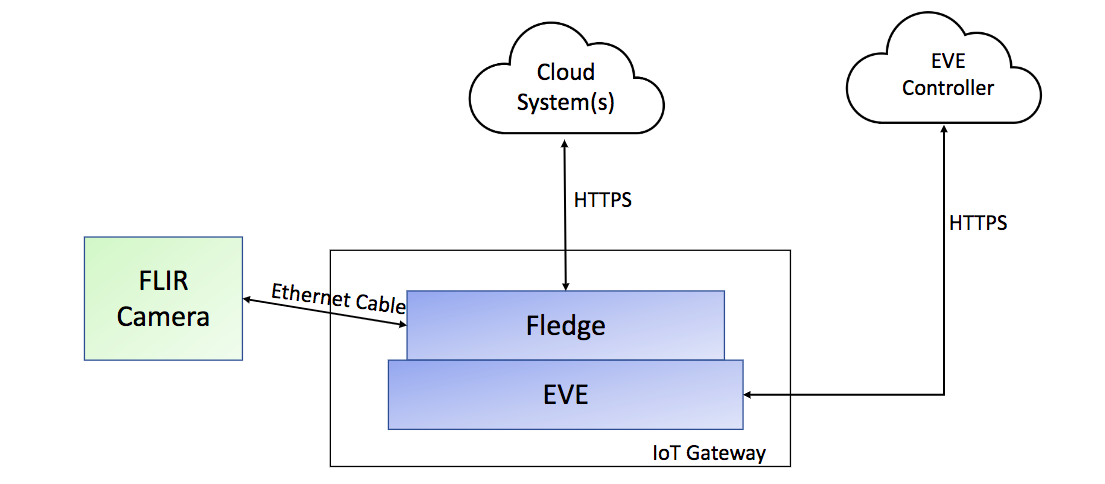
Set up an infrastructure:
...
Stage 4 Setup Fledge container
Open Fledge GUI and Connect to Fledge REST API
Open a browser to the IP and port of the Fledge GUI.
The default port for the Fledge REST API is port 8081. Specify the mapped port and hit “Set the URL & Restart”.
Notice now that Fledge is connected.
Add South Connection to FLIR IR Camera
Click on “South” on the left panel.
Click “Add+” to add a new South Service.
Specify the FlirAX8 South Plugin and specify a logical name, like “FLIR Camera”.
Click Next.
Specify the plugin configuration.
- Asset Name: The asset name readings should be organized into
- Server Address: Address of FLIR Camera Modbus Server
- Port: Port of FLIR Camera Modbus Server
- Slave ID: FLIR Camera Modbus slave ID
You may leave the “Asset Name” and “Slave ID” as is. But make sure to specify the correct IP and Port of the FLIR Camera Modbus Server. Click next.
Deselect “Enabled” so that the service is not started upon creation. We will do this to first attach a filter to only ingest valid data. Click “Done”.
...
Open the FLIR Camera configuration by clicking “FLIR Camera”. Click “Applications +”.
Select FlirValidity and give the filter instance a name such as “FLIR Valid Data”. Click Next.
Specify names for areas of interest. You may copy and paste the following as “Area Labels”:
{
"areas": [
"box1",
"box2",
"box3",
"box4",
"box5",
"box6"
]
}
...
Notice that the FLIR Camera South Service has a new filter named FLIR Valid Data.
Now Select “Enabled” and click “Save” to start the south service with the filter.
Wait a few seconds, and the newly enabled service will begin to collect readings.
Click on “Assets and Readings” and open the AX8 asset.
View the readings as they come in.
Adding a filter
Fledge allows you to transform data in flight. Transformations can be as simple as converting a temperature from Celsius to Fahrenheit, or more complex, such as using a Fast Fourier Transform (FFT) plugin or a Machine Learning (ML) plugin to predict when maintenance is required on a piece of machinery.
Fledge has a number of built-in Filter plugins. The Scale filter allows a scale factor and an offset to be applied to numerical data. We’ll use this to convert the FLIR IR camera temperatures from Kelvin to Fahrenheit.
A scale of 1.8 and an offset of -459.67 will be used.
To add the scale filter, open the FLIR Camera configuration by clicking “FLIR Camera”. Click “Applications +”.
Select the scale plugin and specify the name “Fahrenheit”. Click “Next”.
Specify 1.8 for the “Scale Factor” and -459.67 for the “Constant Offset”. Leave the Asset filter empty. Select “Enabled” and click “Done.
Go back to “Assets and Readings” and open the AX8 Readings. The readings will now appear in Fahrenheit rather than Kelvin.
Event Notifications: Creating a Temperature Monitor
Fledge contains an event notification engine. Like everything else in Fledge, the event engine uses plugins. There are two types of Event Plugins:
Rules: Rules are used to define an event. They can be as simple as “when the temperature goes over 100 degrees”, or they can be much more complex.
Actions: Actions are what you want Fledge to do when an event occurs. Built-in actions include:
- create an asset, so that data is sent to other systems such as Industrial historians, databases, cloud services.
- send an email, or a message via Slack, Hangouts, Telegram or other messaging
- make a call to IFTTT (If-This-Then-That), which can execute a wide variety of web services
- execute a python script on Fledge. This can be used to flash a light or ring a bell or process data outside of Fledge, or anything else you can imagine writing code to accomplish.
And like all the other plugins in Fledge, if Fledge doesn’t have the rule or action you need, it’s easy to create your own in Python or C++.
Enable the Notification Service
Open the “Notifications” Tab. By default, the Notification Service is disabled. Click “add & enable now” to turn on the Notification service:
Specify the Name of the Service as “Fledge Notifications” and select “Enabled”. Click “Add”.
Add a Temperature monitoring Notification Instance
First, let’s figure out what temperature we’d like our monitor to fire at. In the “Assets & Readings” tab, view the graph of the AX8 asset. Click on “Summary” and review the attributes:
Take a look at an attribute, say “averagebox1”, whose max value is “93.01998”. We’ll set our threshold for our alarm to be at 93.0 for attribute “averagebox1” of asset “AX8”.
Go back to the Notifications tab. Click “Create Notification Instance+”.
In “Name”, enter “Temperature Monitor”. In “Description”, enter “Monitor the temperature of boiler”. Click Next.
Click “Next”. Choose the “Threshold” rule plugin. This plugin allows you to set a simple rule that evaluates if a data point goes over, goes under, or becomes equal to a value that you set.
Click “Next”. You’ll now see the Threshold Rule configuration page.
Asset Name: This is the Asset Fledge will monitor. Set this to “averagebox1”.
Datapoint Name: This is the Attribute within that Asset which will be monitored. Set this to “AX8”.
Condition: This can be greater than, less than or equal to. Leave as “>”.
Trigger Value: This is the threshold which must be exceeded for an event to occur. Set this value to the value you determined above. I will use 93.0.
Evaluation Data: If this is set to “Single Item”, Fledge will evaluate every reading, one at a time. If this is set to “Window”, then Fledge will evaluate a group of readings, and use the next two parameters to evaluate them. Set this to “Single Item”. Note that the next two parameters won’t be used, but we’ll describe them here for reference.
Window Evaluation: This can be set to Average, Minimum or Maximum. If Evaluation Data is set to Window, Window Evaluation determines the value that will be evaluated by this rule. For example, if Evaluation Data is set to Window and Window Evaluation is set to average and Time Window is set to 30 seconds, then the rule will evaluate the average of the last 30 seconds of data.
Time Window: This is the width of the time window which is evaluated when Evaluation Data is set to “Window”.
Click Next.
Here we’ll choose an Action to take when a rule is triggered. Choose “asset”. This plugin will create a new data asset. Click “Next”.
...
| View file | ||||
|---|---|---|---|---|
|
one shot: if a monitored value goes over a threshold, and stays above that threshold, the event will fire only one time. When the monitored value goes back below the threshold, the rule will be reset and ready to fire again. So, if the value goes over the threshold again, the rule will fire again.
retriggered: if a monitored value goes over and stays above a specified threshold, the rule will be triggered regularly. The default retriggered time is 60 seconds, but this is configurable.
toggled: every time a monitored value goes over a threshold, a “triggered” event will occur. When the value goes back below the threshold, a “cleared” event will occur.
Set the Trigger value to “toggled”. Leave the “enabled” checkbox checked. Click “Done”.
The new Rule instance is now active and watching the AX8 averagebox1 temperature.
Go back to the “Assets and Readings” tab.
Shortly, you should see a new “temperature_monitor” asset appear. Open it up. You can see the event when the temperature threshold was exceeded. Soon after, you’ll see an event when the temperature returned to below the threshold and the event was cleared.