...
The testbed setup is shown in the below diagram.
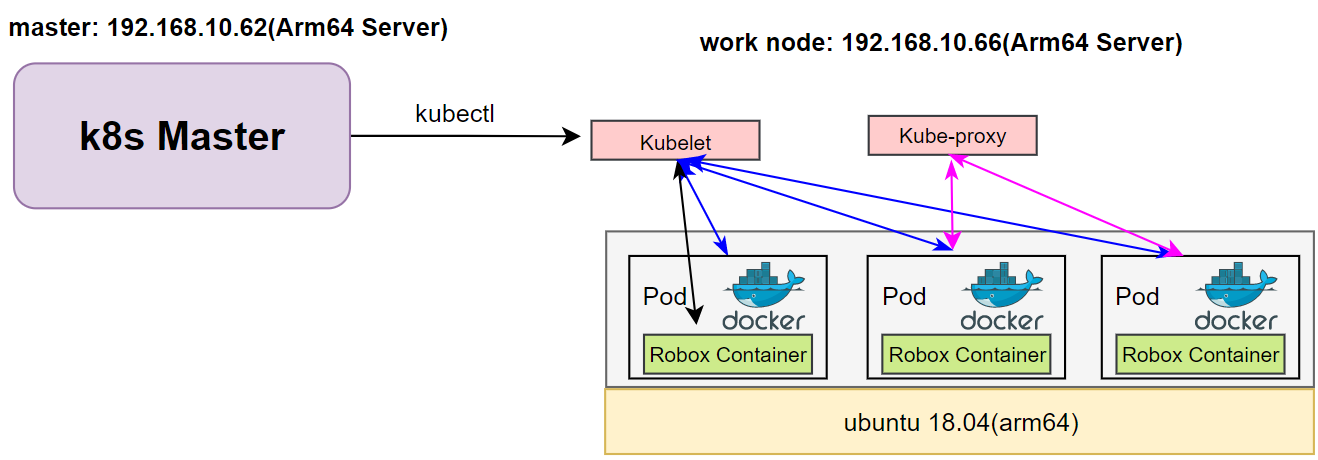
figure1: Run Figure1 Run Robox Through K8s
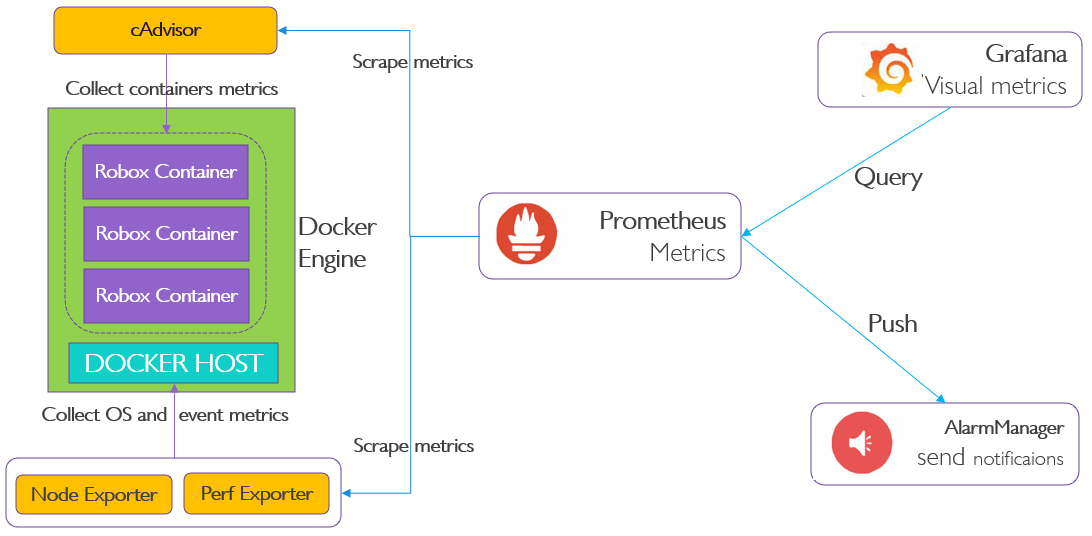
Figure2 figure2: Collect Collect Data From Node
Test Environment
Hardware Requirements
2*arm64 server:
Arch | Aarch64 |
Processor model | 1*Aarch64 processor, 1* Aarch64 processor, |
RAM | 16*DDR4-2933 |
Storage | 10*2.5 inch SAS/SATA/SSD or 8*2.5 inch NVMe SSD |
Network | 1 onboard network card, each card supports 4*GE port or 4*10GE port or 4*25GE port |
Power Supply | Power 100~240V AC,240V DC |
ARM Server satisfies the Arm Server Ready certified.
Software Perequisites
item | description | addition |
os | ubuntu 18.04.3(key) | |
robox | Android container | |
docker | container for android image | apt-get install docker.io |
Components Version
Anbox | Run Android applications on any GNU/Linux operating system. | |
Grafana | Compose and scale observability with one or all pieces of the stack | 8.4.3 |
Prometheus | Cloud native system performance monitoring | 2.34.0 |
K8s |
container orchestration engine for automating deployment, scaling, and management of containerized applications | k8s: v1.23.5; kube-apiserver:v1.21.11 kube-scheduler:v1.21.11 kube-proxy:v1.21.11 etcd:3.4.13-0 coredns:v1.8.0 |
Bootup Basic components
We have cloned the iec repository code to github, the link is:
...
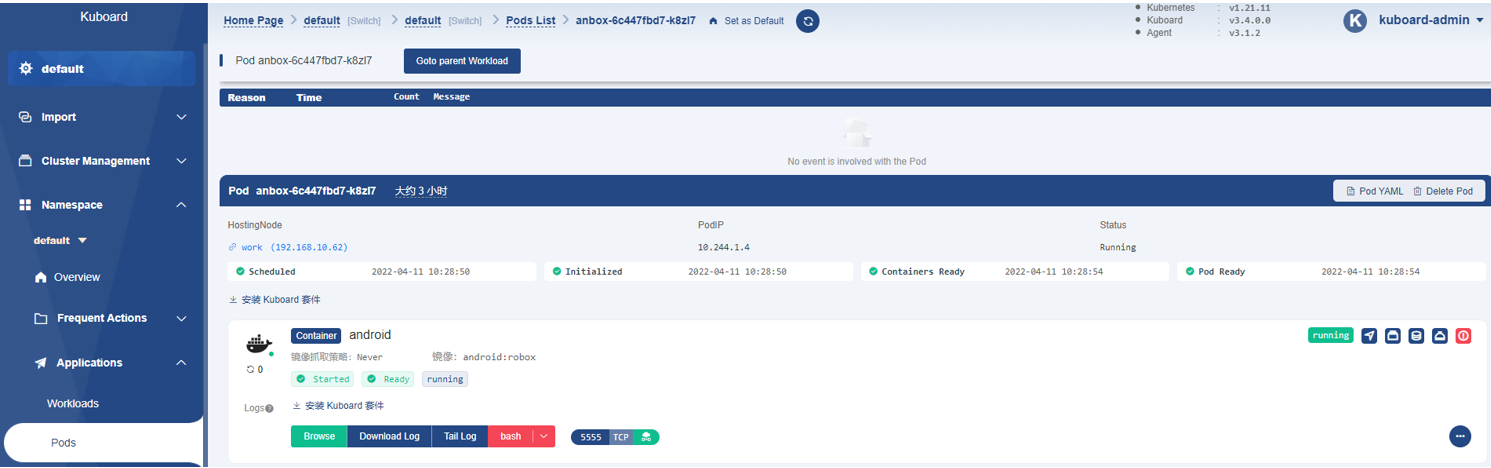
login web browser, then switch to the Pods tab, it display as follow:
3. By Prometheus
login web browser, then switch to the Targets tab, it display as follow:
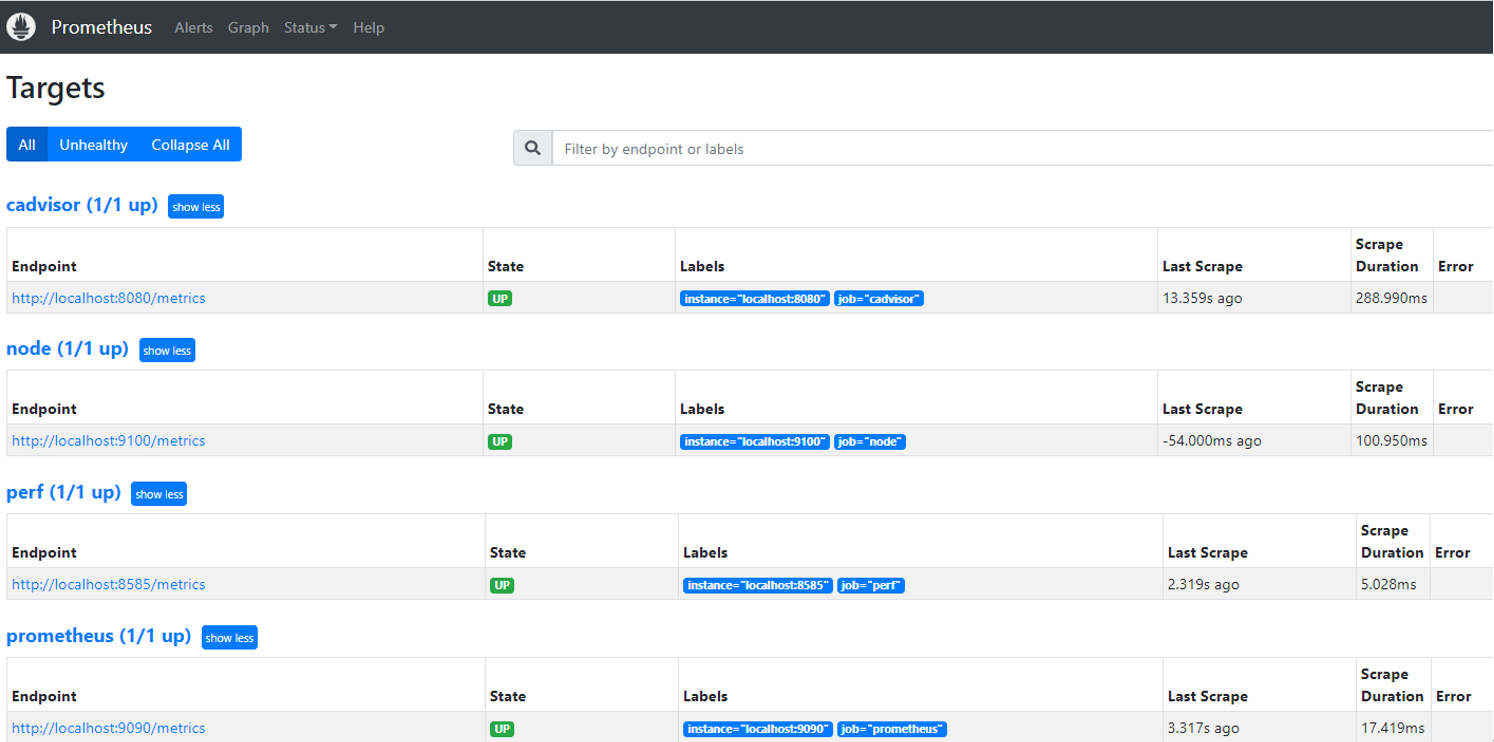
Figure3 Watch cluster pod status through kuboard
3. By Prometheus
login web browser, then switch to the Targets tab, it display as follow:
Figure4 Components on Prometheus
Then switch to the “Status” tab Then switch to the “Status” tab, the box is the event what we want to query, and type “perf_sched_sched_migrate_task”, After a few minutes, you can see
the monitoring curve as bellow:
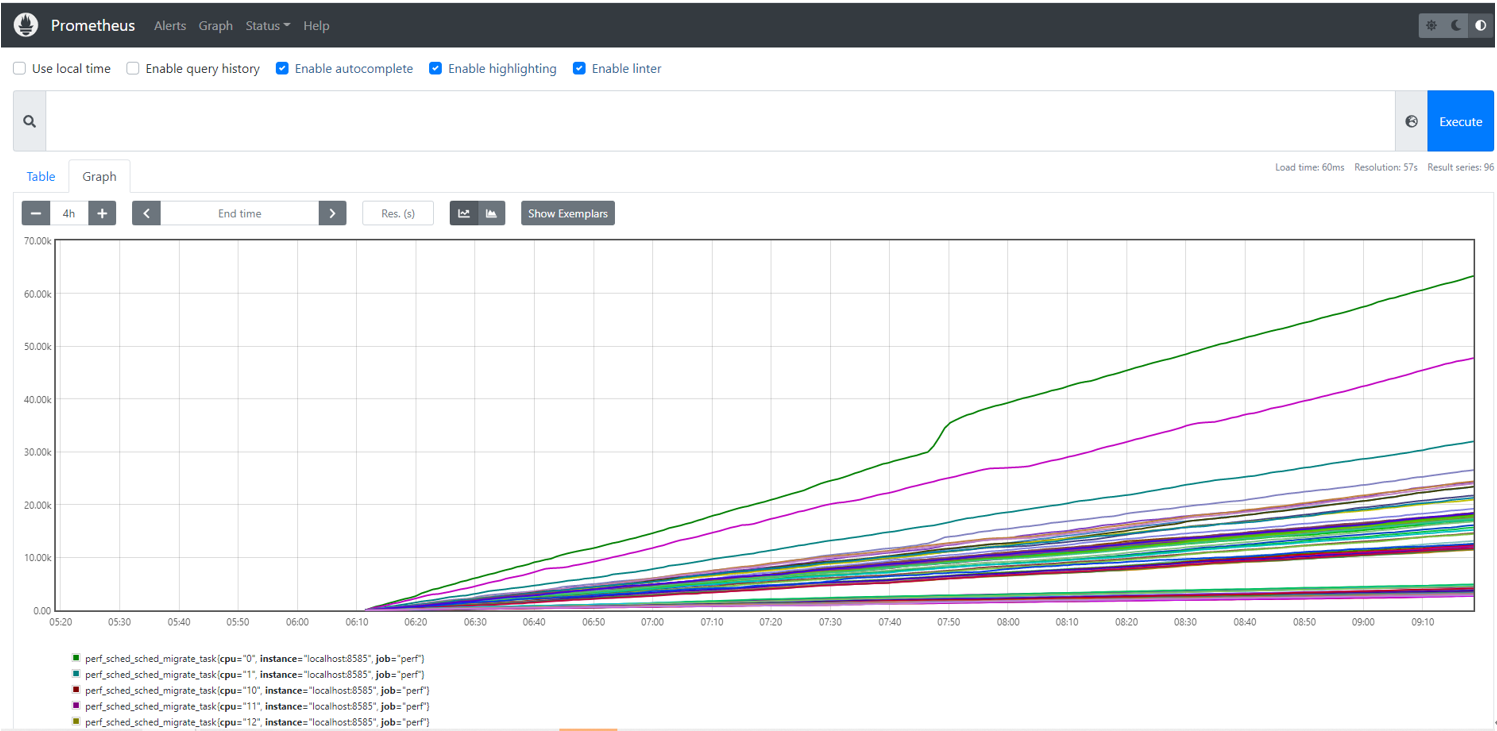
Figure5 Event Statistics On Prometheus
4. By grafana
step1: add data source
...
Click the below on dashboard:
+ -> import -> enter dashboardid 1860(prometheus node is 1860)
Just click load.

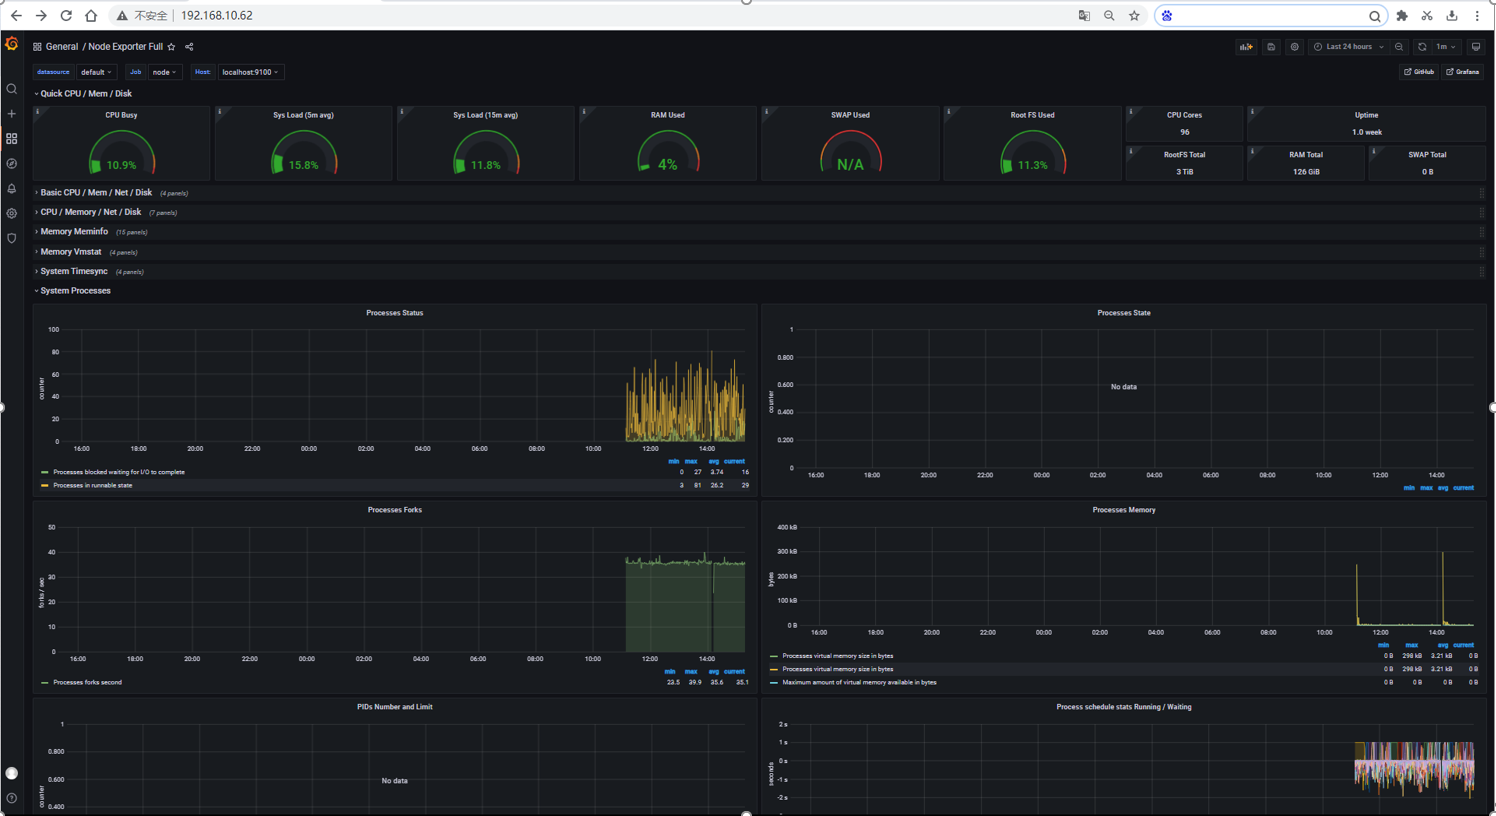
Figure6 Display Display Data Through Grafana
Test API description
The test is to evaluate the Android container available.
...
To increase the workload, we need to start more robox instances.
Download bomb squad apk on googleplay and install via adb
...
Click on the application icon, and then make the relevant settings, such as Auto test mode、Show FPS.
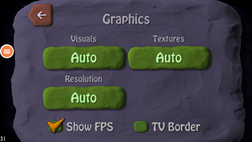

Figure7 Install Apk On Robox Container, Watched By VNC
We ran up to 20 instances on a single node, each instance ran an auto-tested bomb squad app, and we could watch the realtime fps.
...
sudo perf record -e cache-misses -ag -- sleep 10
sudo perf script -i perf.data |../FlameGraph/stackcollapse-perf.pl > out.perf-folded
cat out.perf-folded | ../FlameGraph/flamegraph.pl > perf_cache.svg
sudo perf record -e probe_libc:malloc -agR sleep 10
sudo perf script -i perf.data |../FlameGraph/stackcollapse-perf.pl > out.perf-folded
cat out.perf-folded | ../FlameGraph/flamegraph.pl > perf_malloc.svg
The flame graph display effect is as follows
perf_malloc.svg
The flame graph display effect is as follows
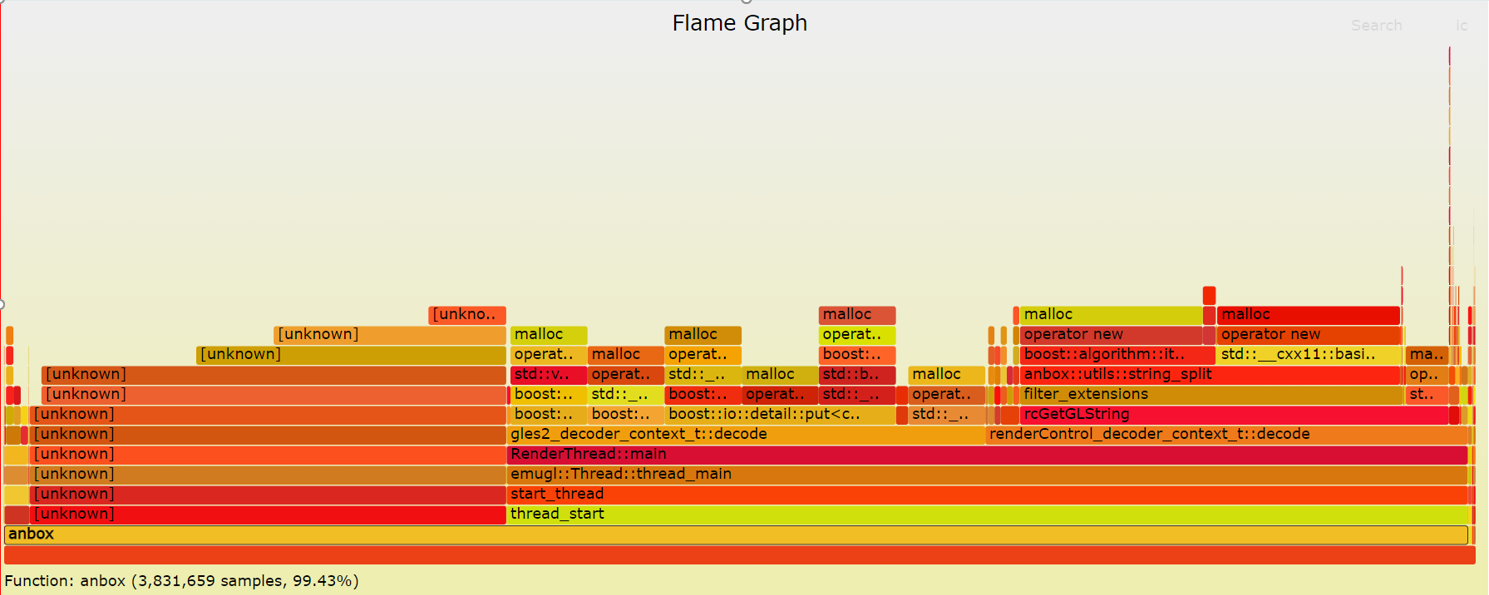
Figure8 Generate Flame Graph From Perf Events
Blueprint extension tests
The Test inputs
Test | Description | Result | Reference |
Robox Image | Robox Image Auto build | PASS | Installation Doc |
Robox Startup | Start Robox By Script | PASS | Installation Doc |
App Installation | Install and run app on a robox | PASS | Current Doc |
Edge Cluster Deployment | Deploy Edge K8S Clusters | Pass | Installation Doc |
Deploy Robox | Run Robox By K8s | PASS | Installation Doc |
Deploy Prometheus | Run Prometheus on Work node | PASS | Installation Doc |
Deploy Grafana | Run Grafana on Work node | PASS | Installation Doc |
Perf events | Run Perf Background to Fetch System Events | PASS | Current Doc |
Flame graph | Generate Flame Graph | PASS | Current Doc |
BluVal Tests
The Test inputs
...
### Input variables cluster's master host
host: 192.168.10.66 # cluster's master host address
username: robox root # login name to connect to cluster
password: 123456 # login password to connect to cluster
ssh_keyfile: /root/.ssh/id_rsa # Identity file for authentication
Since lynis execution requires root privileges, the username here needs to be specified as root
- Run BluVal Robot:
bash validation/bluval/blucon.sh robox
...
Single pane view of how the test score looks like for the Blue print.
Test Group | Total Tests | Pass | Fail |
Blueprint Extension Tests | 10 | 10 | 0 |
Vuls | 1 | 1 | 0 |
Lynis | 1 | 1 | 0 |
K8S Conformance | 1 | 0 | 1 |
Kube-Hunter | 1 | 1 | 0 |
Additional Testing
N/A
Bottlenecks/Errata
...