...
The testbed setup is shown in the below diagram.
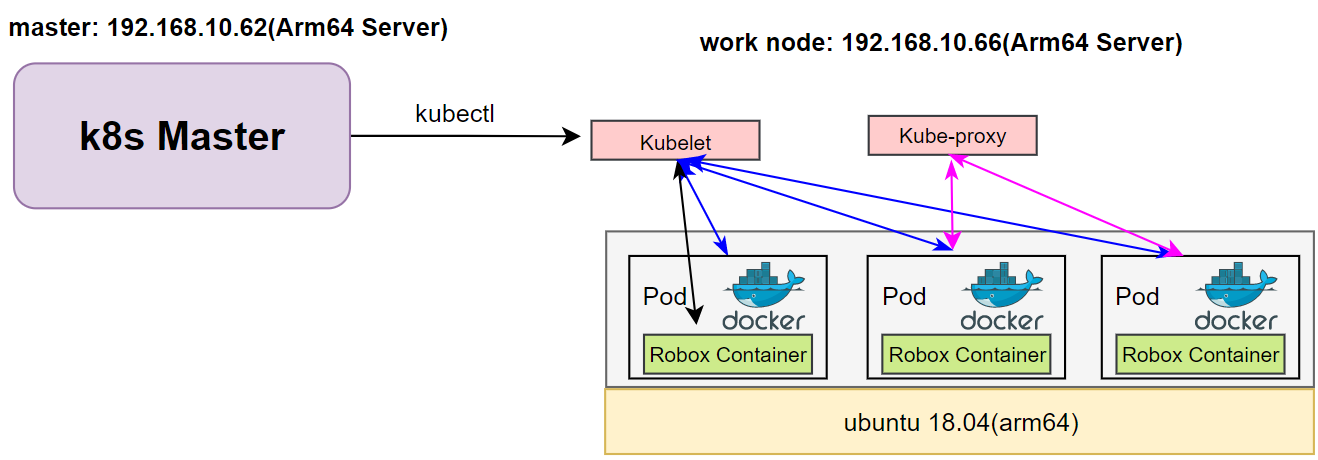
figure1: Run Figure1 Run Robox Through K8s
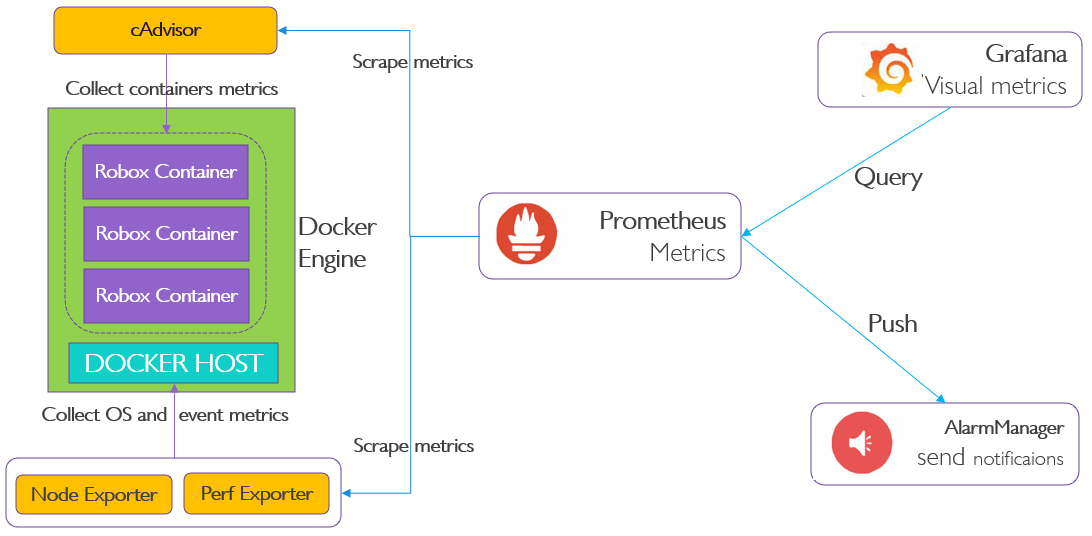
figure2: Collect Figure2 Collect Data From Node
Test Environment
Hardware Requirements
...
login web browser, then switch to the Pods tab, it display as follow:
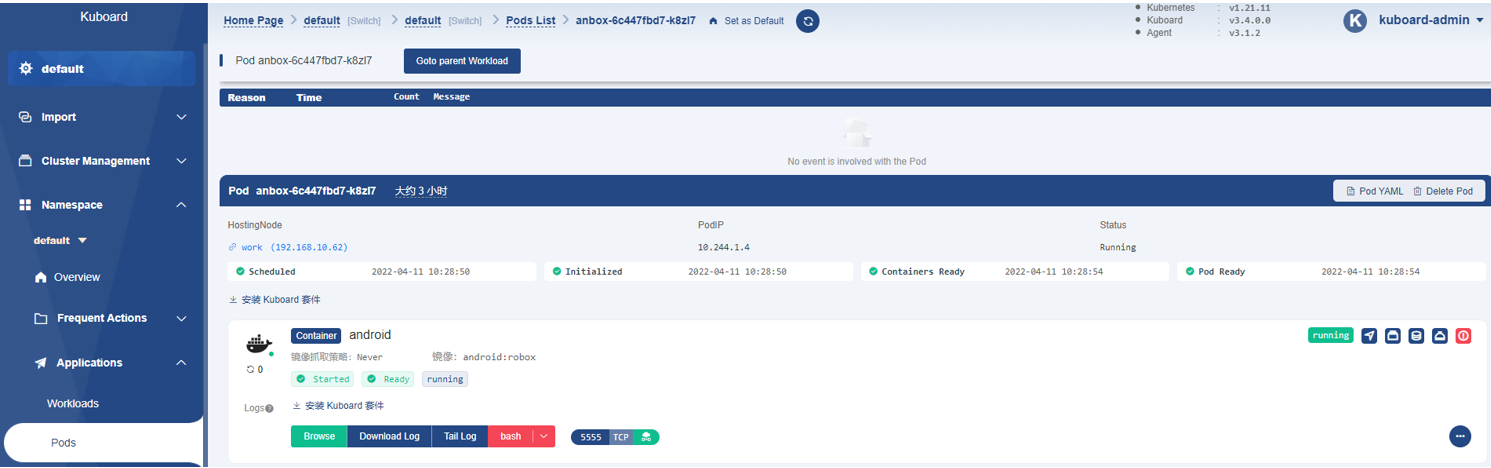
Figure3: Figure3 Watch cluster pod status through kuboard
3. By Prometheus
login web browser, then switch to the Targets tab, it display as follow:
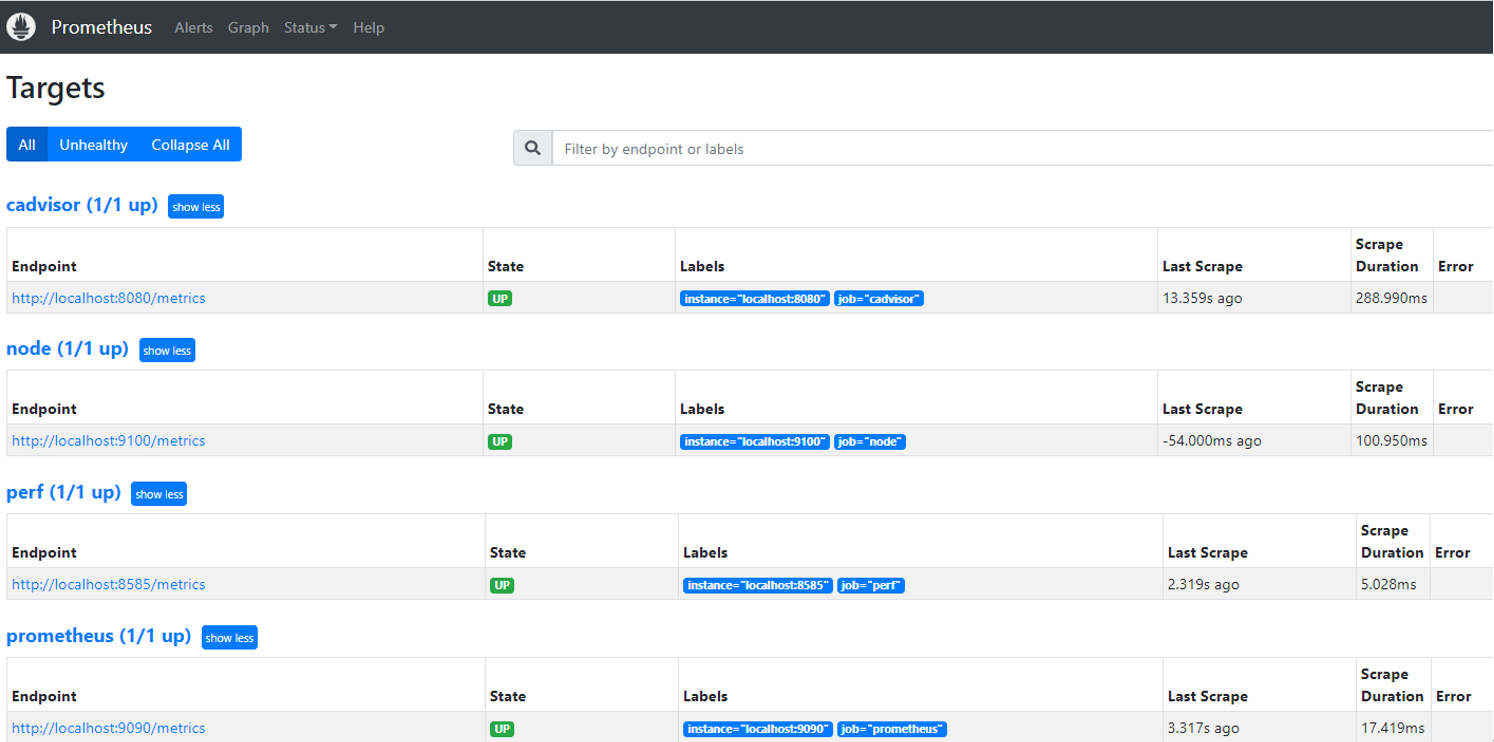
Figure4 Figure4: Components on Prometheus
Then switch to the “Status” tab, the box is the event what we want to query, and type “perf_sched_sched_migrate_task”, After a few minutes, you can see
the monitoring curve as bellow:
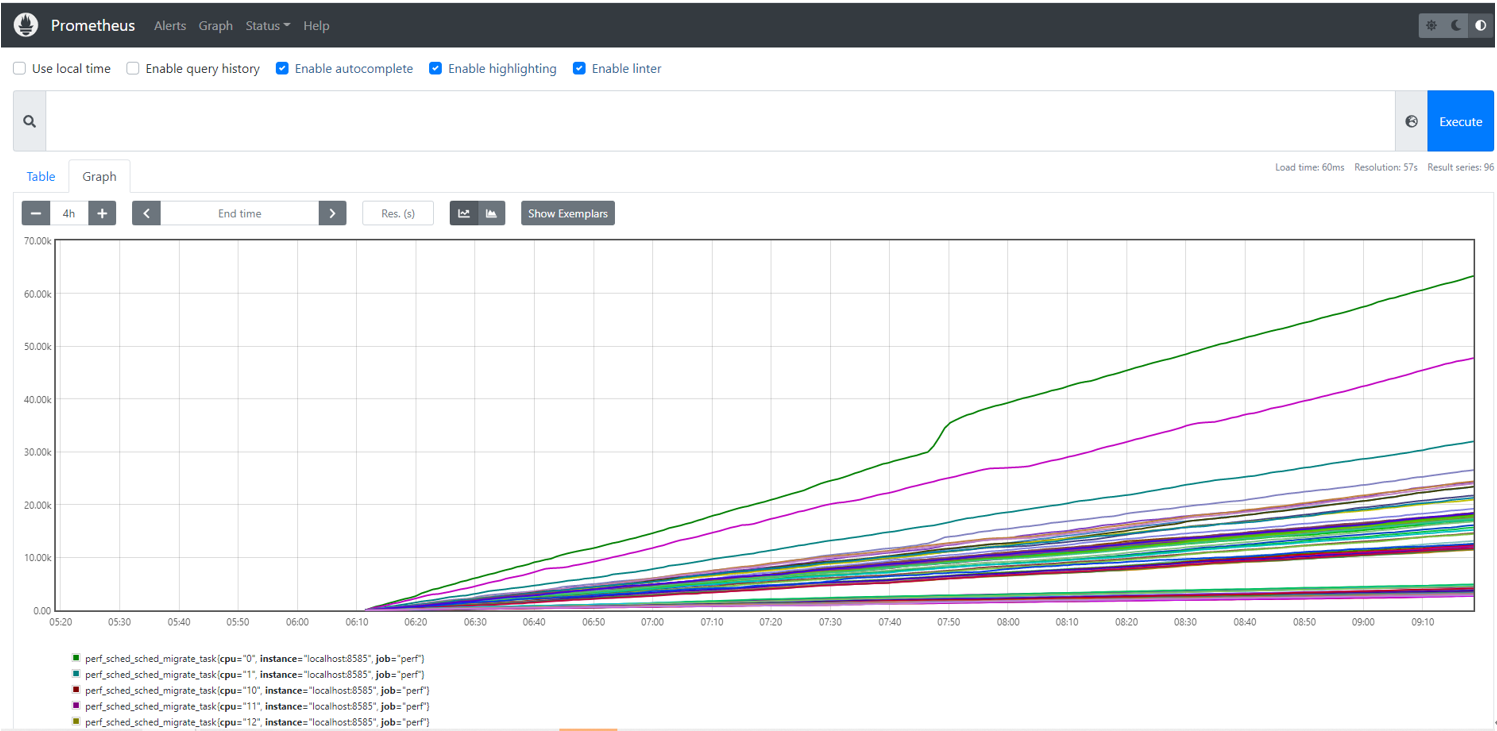
Figure5: Figure5 Event Statistics On Prometheus
4. By grafana
step1: add data source
...
Click the below on dashboard:
+ -> import -> enter dashboardid 1860(prometheus node is 1860)
Just click load.
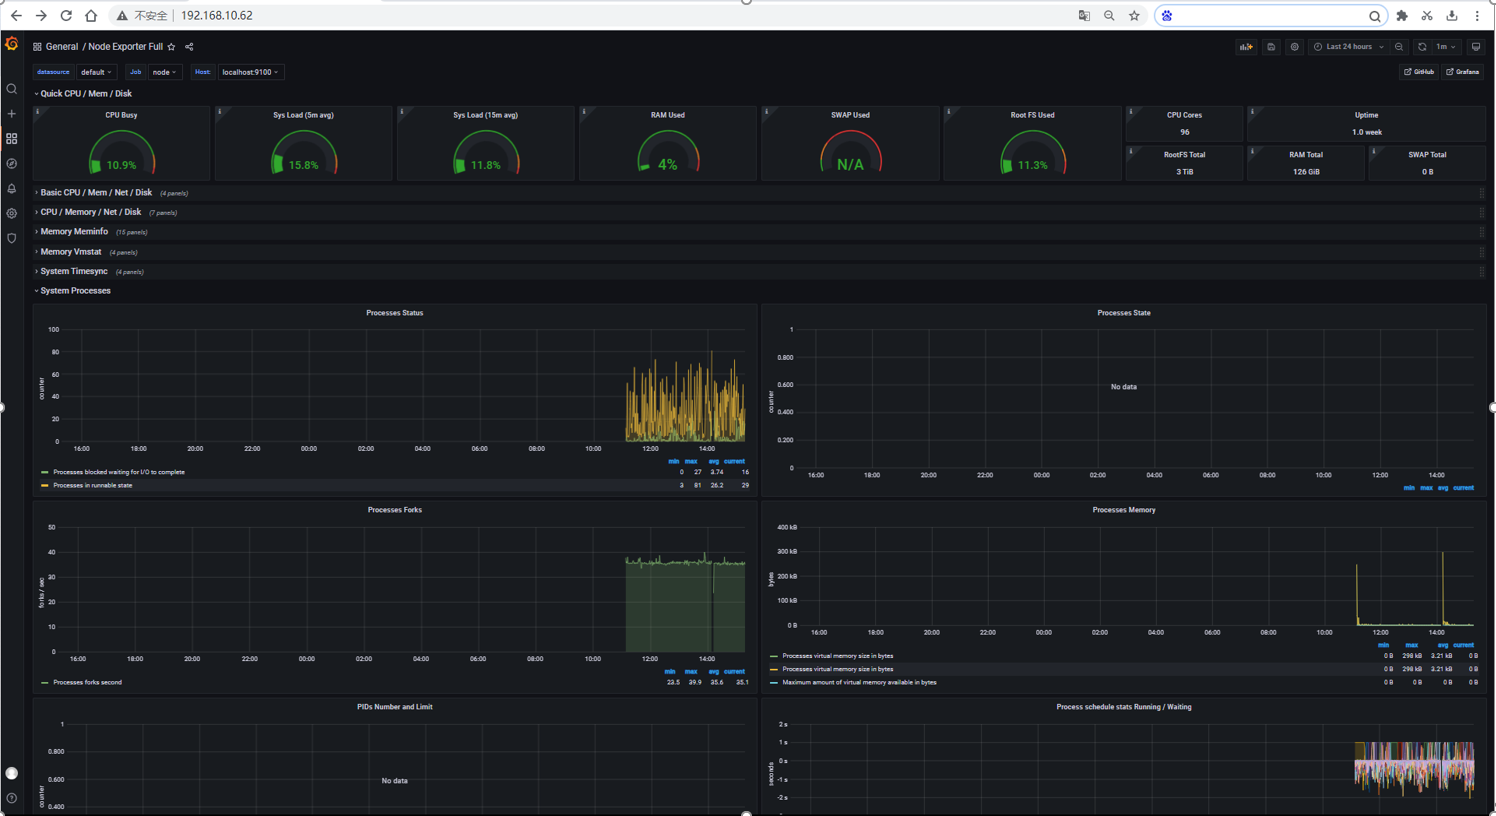
Figure6:Figure6 Display Data Through Grafana
Test API description
The test is to evaluate the Android container available.
...
To increase the workload, we need to start more robox instances.
Figure7: Create Many Robox Instances, Watched By VNC
Download bomb squad apk on googleplay and install via adb
...
Click on the application icon, and then make the relevant settings, such as Auto test mode、Show FPS.
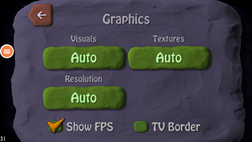

Figure7 Figure8: Install Apk On Robox Container, Watched By VNC
We ran up to 20 instances on a single node, each instance ran an auto-tested bomb squad app, and we could watch the realtime fps.
...
The flame graph display effect is as follows
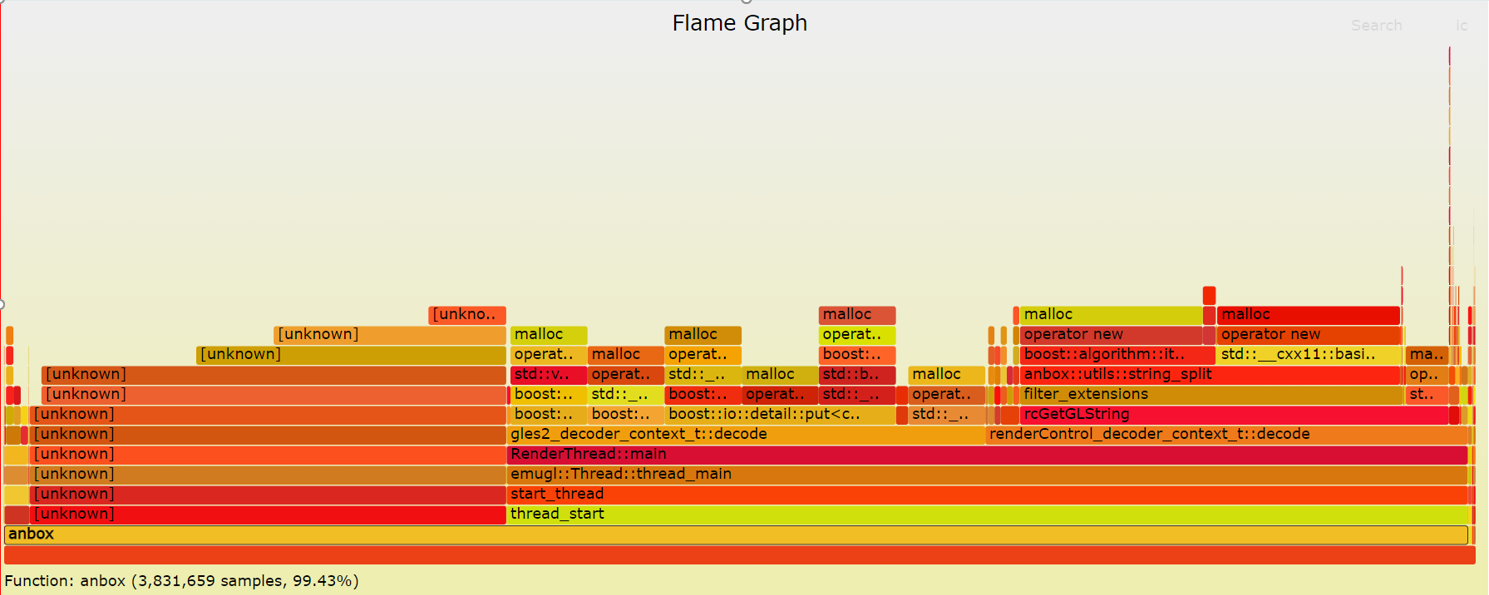
Figure8 Figure9: Generate Flame Graph From Perf Events
Blueprint extension tests
...
### Input variables cluster's master host
host: 192.168.10.66 # cluster's master host address
username: robox root # login name to connect to cluster
password: 123456 # login password to connect to cluster
ssh_keyfile: /root/.ssh/id_rsa # Identity file for authentication
Since lynis execution requires root privileges, the username here needs to be specified as root
- Run BluVal Robot:
bash validation/bluval/blucon.sh robox
...