...
Figure 3. Display of the Blueprint validation results
The user can use the following filters on the results, as is depicted in Figure 3:
- Blueprint layer. The layer of the blueprint
- The overall outcome of the test execution (‘SUCCESS’ or ‘FAILURE’)
- The timestamp associated with a result
Moreover, the following data is displayed for each result, as shown in Figure 3:
- The lab
- The Blueprint name
- The Blueprint version
- The timestamp associated with the result
- The date and time of the result creation
- Whether the optional test cases have been used
- Whether all layers of the blueprint have been used
- The used blueprint layers
- The submission to which this results is associated
- The overall outcome
It should be noted that the user can be further informed about a result by clicking on the button available in the ‘result’ column. Then, the modal illustrated in Figure 4 will be displayed, based on which the user can select a specific test suite of a layer to be demonstrated.
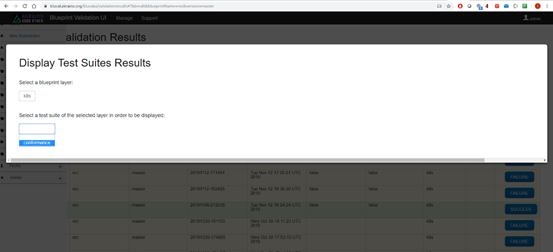
Figure 4. Selection of test suites
Next, details based on these selections will be listed, as is illustrated in Figure 5. Some of these details are the following: test statistics, test execution log and sub-suite robot keywords. The user can hide or show details about the last two items by clicking on them.
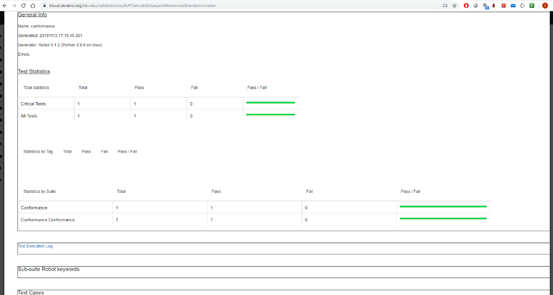
Figure 5. General Info, Test statistics and Test execution log of a test suite